




The ASX 200 jumps out of the gate, but can it make the next hurdle?
The ASX has been swept higher with Wall Street’s short-covering rally and snapped its 5-day decline. But does that make it a bullish move?
Share this:

The ASX 200 has risen around 1.7% at the time of writing after US indices rallied despite the stronger than expected inflation report from the US. Energy stocks have taken the lead with the sector rising 3.8% as they track oil prices higher, and all 11 ASX sectors have posted gains for the day so far. We can’t help but be a little suspicious of the rally, given it is likely fuelled by Wall Street’s short covering. But markets never move in a straight line and must move counter to their own trends once in a while, which leaves the potential for some further upside – at least over the near-term.
ASX 200 weekly chart:
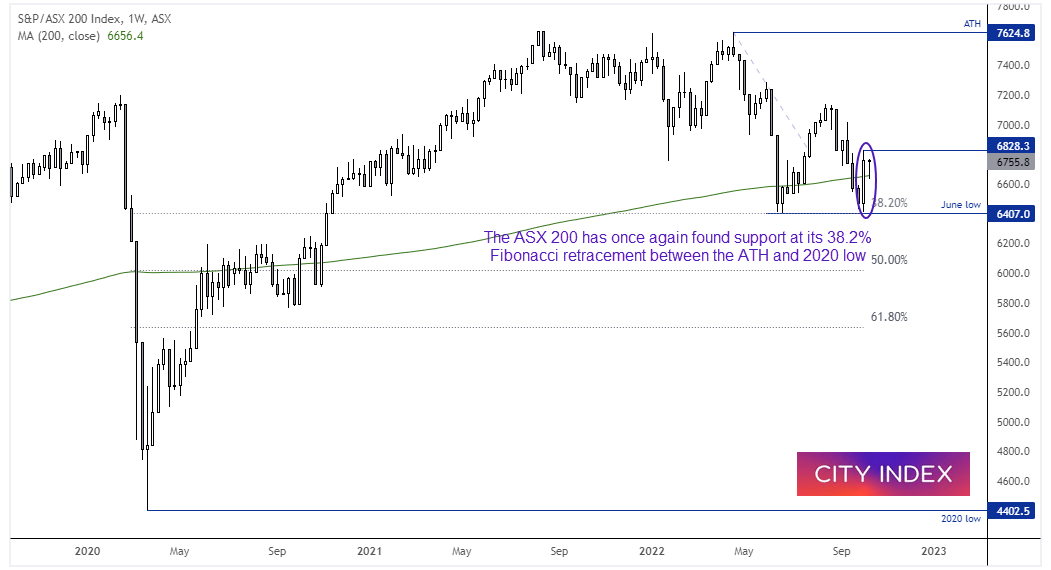

We can see on the weekly chart that ASX 200’s decline from 7324.8 ha once again found support at the 38.2% Fibonacci ratio between the 2020 low and ATH (al-time high). A bullish engulfing candle formed last week which closed above its 200-week MA, and that same MA provided support earlier this week. It was also one of the few major indices to hold above its June low (unlike Wall Street), which made it a prime candidate for a bounce should bearish sentiment east. The question now is whether it can break above the October high of 6828.3.
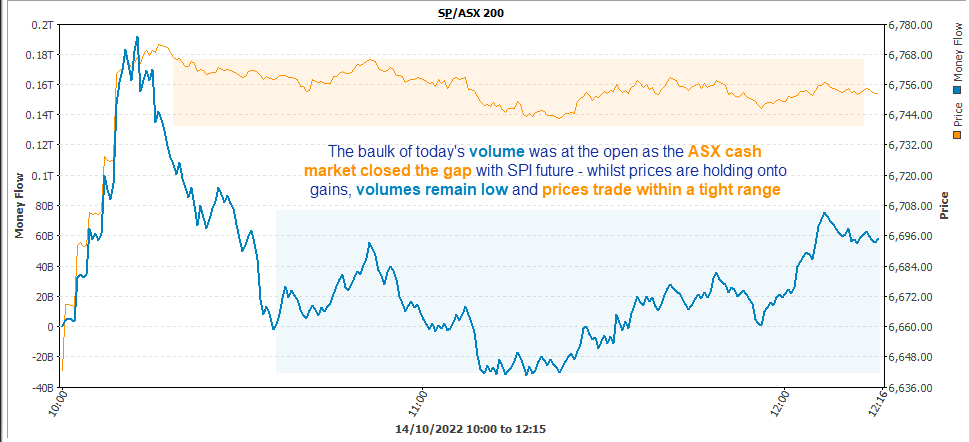
ASX trading volumes are on the ow side today (so far):
The baulk of the day’s volume has been in the first 15 minutes of trade, where the index leapt higher to close its gap with the SPI 200. Sure, it’s holding on to those gains – but at the same time buying has slowed to a trickle as the index trades within a tight range on relatively low volumes. I’m not betting on an imminent break of the October high just yet, especially when it seemingly down to traders ‘selling the rumour and buying the fact’ after another hotter-than-liked inflation print from the US.
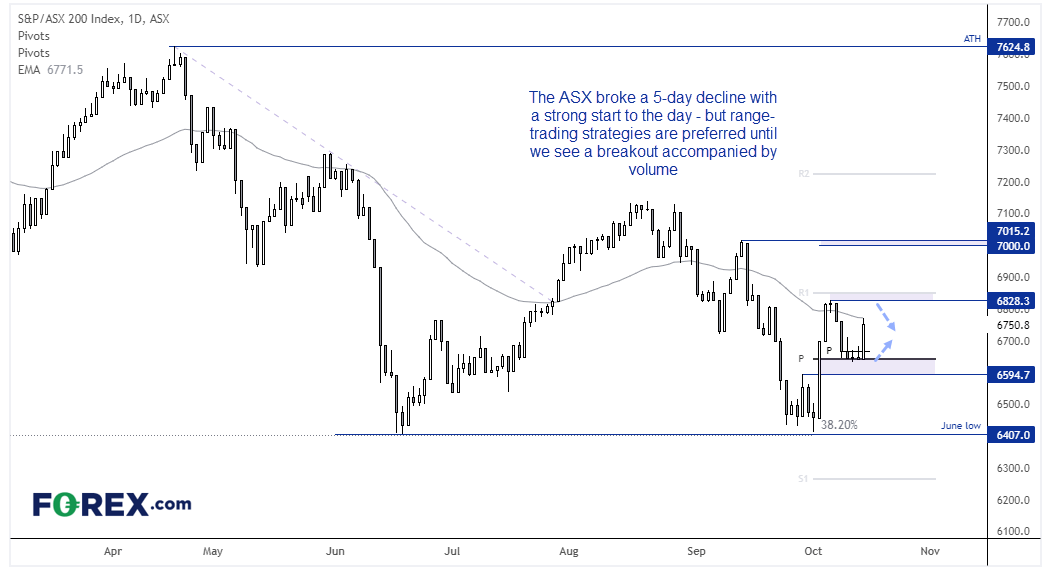
ASX 200 daily chart:
Support has been found around the weekly and monthly pivot points, although the 50-day EMA has capped as resistance today. Due to the lower trading volumes for today’s rally and the fact it has been driven by Wall Street’s short-covering rally, range-trading strategies are preferred between the approximate 6600 – 6530 range.

How to trade with City Index
You can easily trade with City Index by using these four easy steps:
- Open an account, or log in if you’re already a customer
• Open an account in the UK
• Open an account in Australia
• Open an account in Singapore
- Search for the company you want to trade in our award-winning platform
- Choose your position and size, and your stop and limit levels
- Place the trade
How to trade with FOREX.com
Follow these easy steps to start trading with FOREX.com today:
- Open a Forex.com account, or log in if you’re already a customer.
- Search for the pair you want to trade in our award-winning platform.
- Choose your position and size, and your stop and limit levels.
- Place the trade.
Related tags:

Open an account in minutes
Experience award-winning platforms with fast and secure execution.
Economic calendar
Web Trader platform
Our sophisticated web-based platform is packed with features.
Related articles

ASX 200 Outlook: Potential to Bounce Sits on a Knife Edge
ASX 200 bounce prospects remain on a knife edge as oversold technicals clash with weak financials, commodity pressures and global risk aversion.

US dollar rally loses yield support as Nvidia looms
US yields are retreating, but the dollar isn't following. With risk aversion potentially keeping it supported, Nvidia's results could determine whether emerging reversal signals in AUD/USD and EUR/USD develop further.

GBP/USD, GBP/JPY, GBP/AUD: Sterling Eyes UK Inflation Catalyst
Sterling faces a pivotal UK inflation test as traders weigh BoE tightening, Fed minutes and Australian employment data across GBP/USD, GBP/JPY and GBP/AUD.
StoneX Financial Ltd (trading as "FOREX.com") is an execution-only service provider. This material, whether or not it states any opinions, is for general information purposes only and it does not take into account your personal circumstances or objectives. This material has been prepared using the thoughts and opinions of the author and these may change. However, FOREX.com does not plan to provide further updates to any material once published and it is not under any obligation to keep this material up to date.
This material is short term in nature and may only relate to facts and circumstances existing at a specific time or day. Nothing in this material is (or should be considered to be) financial, investment, legal, tax or other advice and no reliance should be placed on it. No opinion given in this material constitutes a recommendation by FOREX.com or the author that any particular investment, security, transaction or investment strategy is suitable for any specific person.
The material has not been prepared in accordance with legal requirements designed to promote the independence of investment research. Although FOREX.com is not specifically prevented from dealing before providing this material, FOREX.com does not seek to take advantage of the material prior to its dissemination. This material is not intended for distribution to, or use by, any person in any country or jurisdiction where such distribution or use would be contrary to local law or regulation. For further details see our full non-independent research disclaimer and quarterly summary.