



USD/JPY Plunges from 158 as Yen Surges on Another Suspected Intervention
USD/JPY drops ~200 pips from 158 as yen surges on suspected MOF intervention, with volatility spiking and downside risks building.
Share this:

While we’re yet to receive official confirmation of intervention from Japan’s Ministry of Finance (MOF), the price action strongly suggests it occurred, once again. A series of verbal warnings from officials, a rising USD/JPY, and increasingly bearish yen positioning in futures markets set the stage—while thin holiday liquidity provided the ideal conditions for a sharp reversal.
USD/JPY is now down around 200 pips (-1.3%) after its three-day rally stalled just shy of 158. I flagged that resistance zone in this morning’s report, and moves like this make you wonder whether the MOF pays attention to technical levels—because it played out almost perfectly.
View related analysis:
View related analysis:
USD/JPY Falls from 158 as Yen Surges on Suspected MOF Intervention
Yen Intervention Signals Potential USD/JPY Top
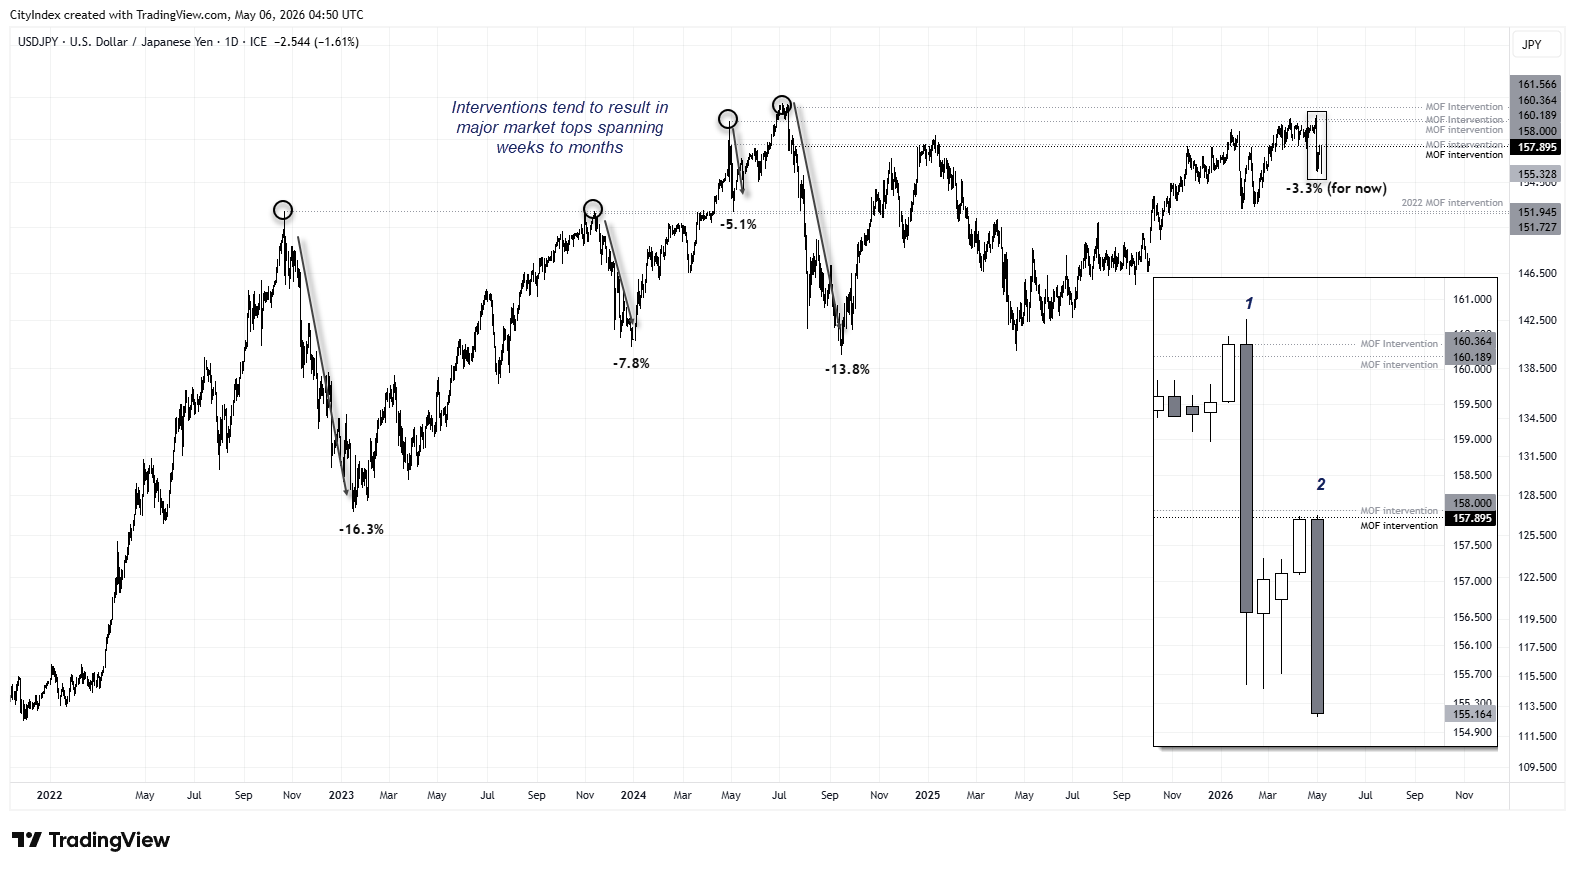
It is worth noting that yen intervention has historically aligned with meaningful tops in USD/JPY, often lasting weeks to months. The 2022 peak saw USD/JPY fall -16.3%, while the 2024 top delivered a -13.8% decline. Even the smallest move of -5.1% exceeds the current pullback of around -3.3% from the cycle high.
With Europe and the US yet to fully react—and the US dollar already under pressure following the latest ‘peace deal’ headlines—it may take time before USD/JPY makes another attempt at 158.
Source: ICE, TradingView


Yen Leads Broad FX Moves as Volatility Spikes
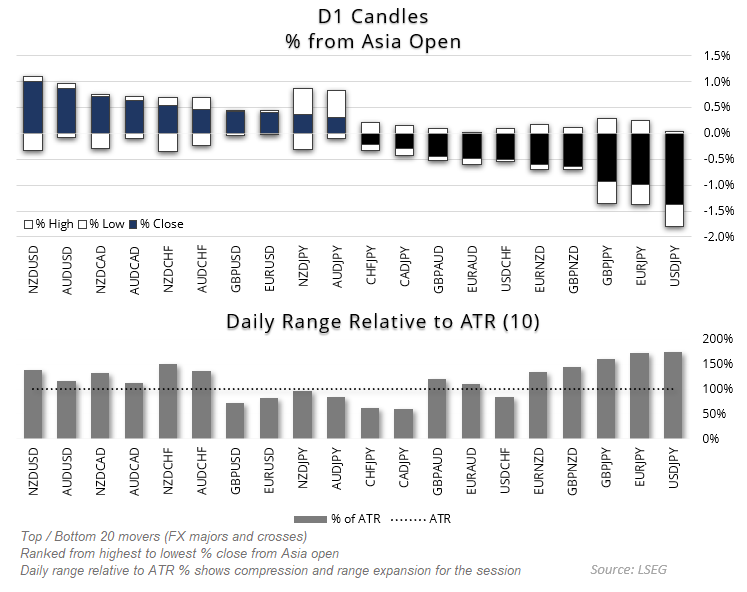
The Japanese yen is the strongest major this session, with USD/JPY, EUR/JPY and GBP/JPY leading declines by % move. Notably, several FX majors have already exceeded their average daily range—something rarely seen during the Asian session.
This suggests aggressive repricing rather than a gradual move. With multiple pairs pushing beyond 100% of their 10-day ATR, volatility is clearly expanding, raising the risk of further follow-through as European and US traders react.
Source: LSEG
USD/JPY Technical Analysis: US Dollar vs Japanese Yen
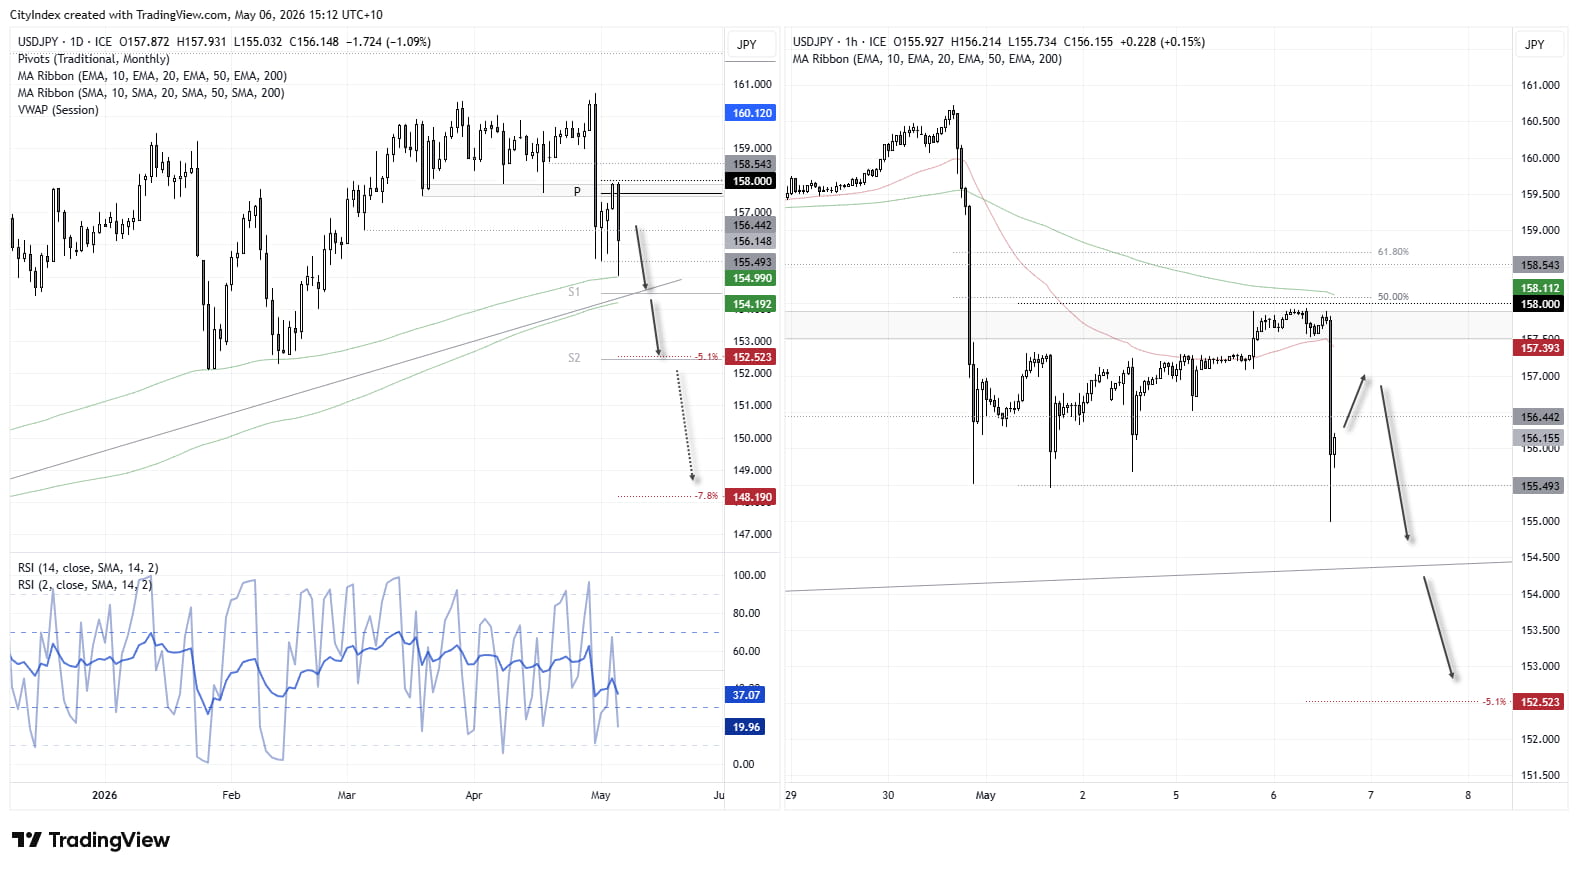
The daily chart shows USD/JPY is on track for a bearish outside day, though support has been found at its 200-day EMA for now. Given we have already seen it recoup over a third of the alleged intervention losses in the past hour, perhaps it can retrace a little higher from here. But with the powers that be not happy with yen strength, USD/JPY bears may be looking to re-enter once the dust settles.
156.50 and 157 make potential areas for them to fade into in anticipation of a retest of trend support near the 200-day SMA. Bu for reference, a -5.1% decline – the minimum seen in recent interventions – could see USD/JPY fall to the monthly S2 pivot just above the 152 handle.
Source: LSEG
View the full economic calendar
View the full economic calendar
-- Written by Matt Simpson
Follow Matt on Twitter @cLeverEdge
How to trade with City Index
You can trade with City Index by following these four easy steps:
- Open an account, or log in if you’re already a customer
• Open an account in the UK
• Open an account in Australia
• Open an account in Singapore
- Search for the market you want to trade in our award-winning platform
- Choose your position and size, and your stop and limit levels
- Place the trade
Related tags:

Open an account in minutes
Experience award-winning platforms with fast and secure execution.
Economic calendar
Web Trader platform
Our sophisticated web-based platform is packed with features.
Related articles

NZD/USD Forecast: Kiwi faces historic breakdown as RBNZ survey looms
NZD/USD is teetering above support that held through the pandemic and Liberation Day turmoil. With RBNZ hawks repeatedly disappointed, today's inflation expectations survey could open the door to a slide towards the GFC lows.

USD/JPY, AUD/JPY: Central Bank Divergence Creates Two-Way Risk
USD/JPY eyes a breakout above 160, while AUD/JPY faces further losses as Fed, RBA and BoJ interest rate expectations diverge.

DXY, GBP/USD, AUD/USD, USD/CAD, USD/JPY, Gold Weekly Technical Outlook 11 16 2026
Sr. Technical Strategist Michael Boutros highlights the levels that matter on the USD Majors, commodities, and equity indices charts this week.

StoneX Financial Ltd (trading as "FOREX.com") is an execution-only service provider. This material, whether or not it states any opinions, is for general information purposes only and it does not take into account your personal circumstances or objectives. This material has been prepared using the thoughts and opinions of the author and these may change. However, FOREX.com does not plan to provide further updates to any material once published and it is not under any obligation to keep this material up to date.
This material is short term in nature and may only relate to facts and circumstances existing at a specific time or day. Nothing in this material is (or should be considered to be) financial, investment, legal, tax or other advice and no reliance should be placed on it. No opinion given in this material constitutes a recommendation by FOREX.com or the author that any particular investment, security, transaction or investment strategy is suitable for any specific person.
The material has not been prepared in accordance with legal requirements designed to promote the independence of investment research. Although FOREX.com is not specifically prevented from dealing before providing this material, FOREX.com does not seek to take advantage of the material prior to its dissemination. This material is not intended for distribution to, or use by, any person in any country or jurisdiction where such distribution or use would be contrary to local law or regulation. For further details see our full non-independent research disclaimer and quarterly summary.