



USDCAD rebound could be short lived
The USD/CAD ended its bullish run abruptly on Friday as investors shrugged off employment reports from Canada (weak) and US (strong) and instead focused on a sharp rebound in oil prices. However, there has been no real follow-through in the selling pressure at the start of this week.
Share this:

The USD/CAD ended its bullish run abruptly on Friday as investors shrugged off employment reports from Canada (weak) and US (strong) and instead focused on a sharp rebound in oil prices. However, there has been no real follow-through in the selling pressure at the start of this week.
In part, this is due to a sharp rebound in the Dollar Index. The greenback has finally managed to catch a bid against the single currency as traders who had bought the EUR/USD pair in anticipation of Marcon’s victory in French elections, evidently took profit today. The GBP/USD has also weakened in the EUR/USD’s slipstream, while the USD/JPY has bounced back after a weaker open.
Another reason for the bounce in the USD/CAD has been oil prices which have fallen again despite on-going jawboning from Saudi’s oil minister, who has again spoken in favour of extending the OPEC productions cuts.
But despite the weakness in crude oil prices and US dollar’s bullish day, the USD/CAD could still fall back now that it is testing a key resistance area and after posting reversal-looking price patterns at the end of last week.
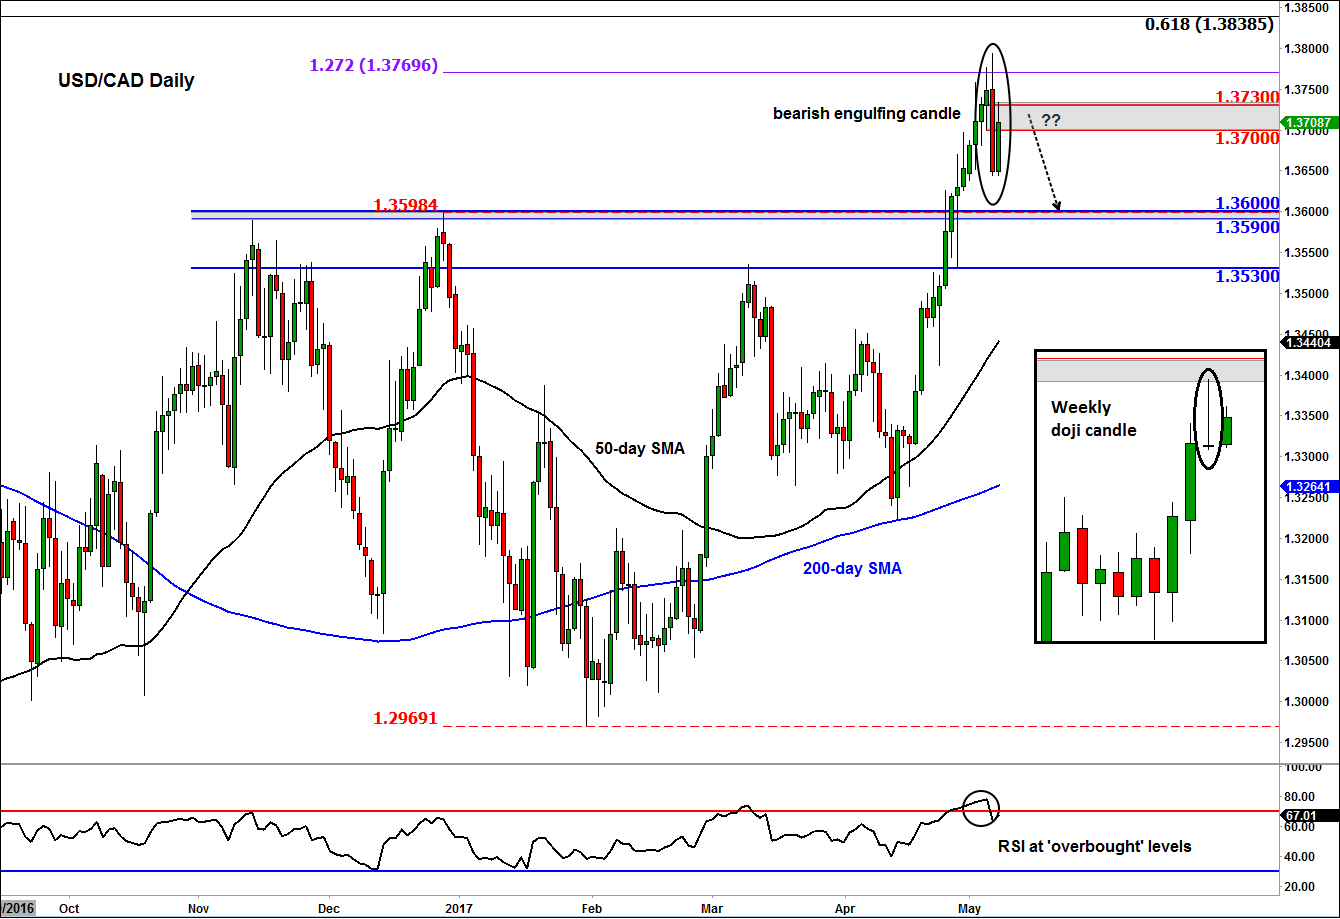
As can be seen on the chart, the USD/CAD reversed sharply on Friday to create a bearish engulfing candle on its daily chart. The resulting sell-off caused the weekly chart to print a doji candle, which is typically found at tops and bottoms of a trend.
If these technical signals are valid bearish signs then today’s bounce in the USD/CAD could be a trap for the bulls and present an opportunity for the bears to get on board at favourable prices.
In fact, the USD/CAD was testing a key short-term level around 1.3730 at the time of this writing. This level was the last support pre-breakdown on Friday (one can see this level on an intraday chart). Consequently, it could turn into resistance, leading to another drop.
However, if the USD/CAD doesn’t turn lower here and goes on to break above last week’s high then this would invalidate the bearish setup. In this potential scenario, the Loonie may rise to test the long-term 61.8% Fibonacci retracement level at 1.3840 as the next bullish objective, possibly ahead of 1.40 next.
Source: eSignal and FOREX.com.
Latest market news




Open an account in minutes
Experience award-winning platforms with fast and secure execution.
Economic calendar
Web Trader platform
Our sophisticated web-based platform is packed with features.
Related articles
USD/JPY, AUD/JPY: Central Bank Divergence Creates Two-Way Risk
USD/JPY eyes a breakout above 160, while AUD/JPY faces further losses as Fed, RBA and BoJ interest rate expectations diverge.
DXY, GBP/USD, AUD/USD, USD/CAD, USD/JPY, Gold Weekly Technical Outlook 11 16 2026
Sr. Technical Strategist Michael Boutros highlights the levels that matter on the USD Majors, commodities, and equity indices charts this week.

Nasdaq 100 Forecast: NDX falls ahead of Nvidia’s earnings & Anthropic’s debut this week
U.S. stocks are heading for a weaker open amid a challenging macro backdrop and with AI-linked stocks once again under pressure ahead of Nvidia's results later this week. Attention is also turning to Anthropic's highly anticipated IPO.

StoneX Financial Ltd (trading as "FOREX.com") is an execution-only service provider. This material, whether or not it states any opinions, is for general information purposes only and it does not take into account your personal circumstances or objectives. This material has been prepared using the thoughts and opinions of the author and these may change. However, FOREX.com does not plan to provide further updates to any material once published and it is not under any obligation to keep this material up to date.
This material is short term in nature and may only relate to facts and circumstances existing at a specific time or day. Nothing in this material is (or should be considered to be) financial, investment, legal, tax or other advice and no reliance should be placed on it. No opinion given in this material constitutes a recommendation by FOREX.com or the author that any particular investment, security, transaction or investment strategy is suitable for any specific person.
The material has not been prepared in accordance with legal requirements designed to promote the independence of investment research. Although FOREX.com is not specifically prevented from dealing before providing this material, FOREX.com does not seek to take advantage of the material prior to its dissemination. This material is not intended for distribution to, or use by, any person in any country or jurisdiction where such distribution or use would be contrary to local law or regulation. For further details see our full non-independent research disclaimer and quarterly summary.