






USDCHF Signaling Risk On
If stocks move higher, USD/CHF may continue its move back towards parity.
Share this:

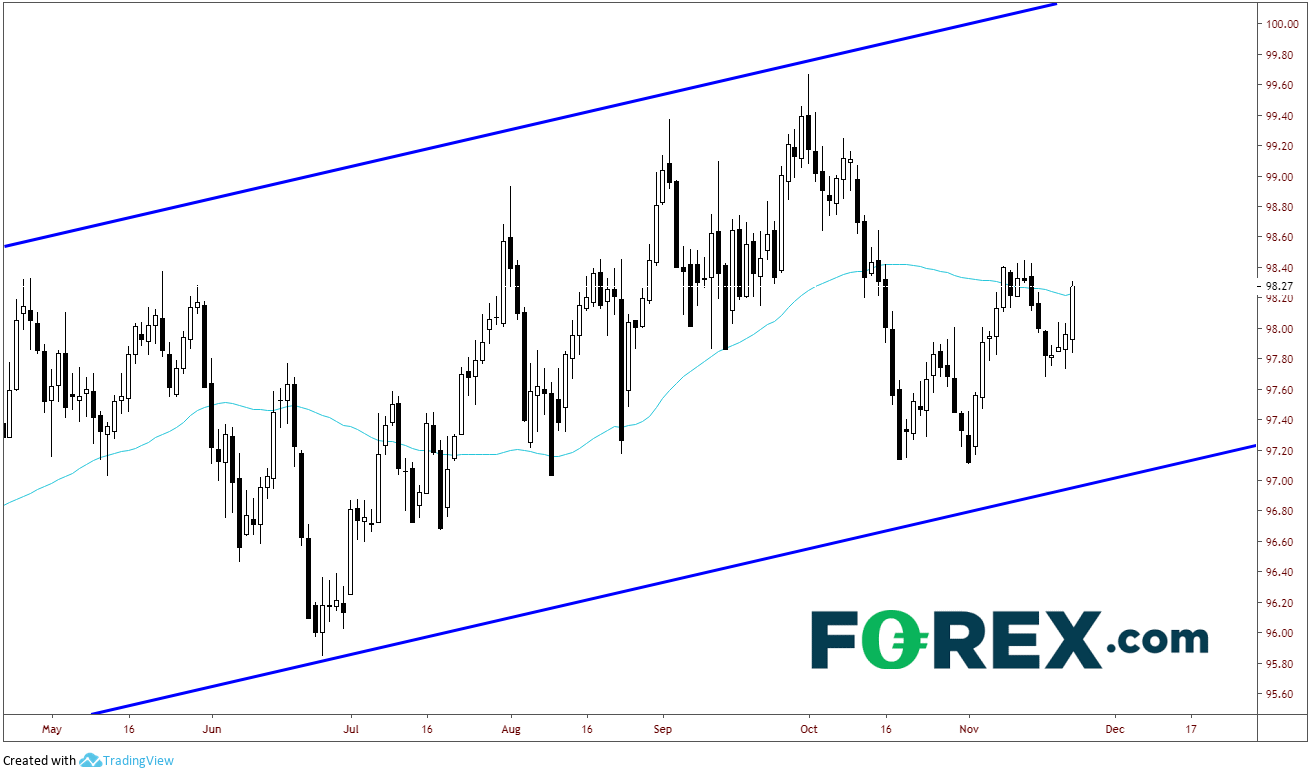
Today is Friday. As we have seen in recent weeks, US President Trump likes talk on the US-China “deal in progress” on Fridays. Today was no different, as Trump earlier said that the China trade deal is coming along very well. Stocks have heard it too many times before and the S&P 500 is trading in a tight trading range for the day. But is that the reason the DXY was bid all day? Perhaps it was the delayed reaction to the US data this morning?
Source: Tradingview, City Index
Regardless of the reason the move in DXY, USD/CHF is up nearly 0.5% on a day, whereas many other US Dollar pairs are trading in much tighter ranges. The USD/CHF is considered a directional indicator for the stock market. If USD/CHF moves higher, it is considered “risk on”. If the pair moves lower, it is considered “risk off”.
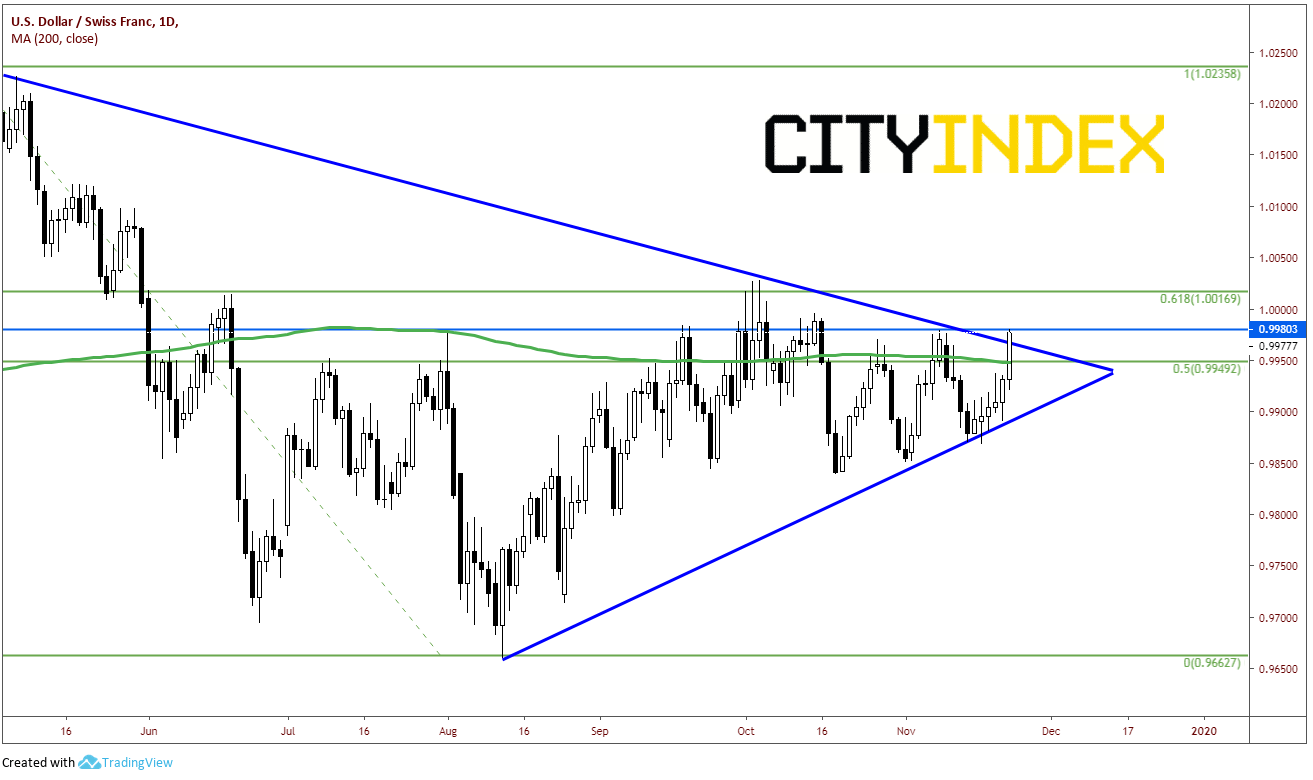
USD/CHF has been trading in a symmetrical triangle, as have other US Dollar pairs, since late April. As such, price has reached the apex and is coiling around the 200 Day Moving Average. However today is the sixth straight trading session that USD/CHF has closed higher. The pair busted through the 200 Day Moving Average closed above the descending trendline of the triangle for the first time at prior highs and horizontal resistance near .9980.
Source: Tradingview, City Index
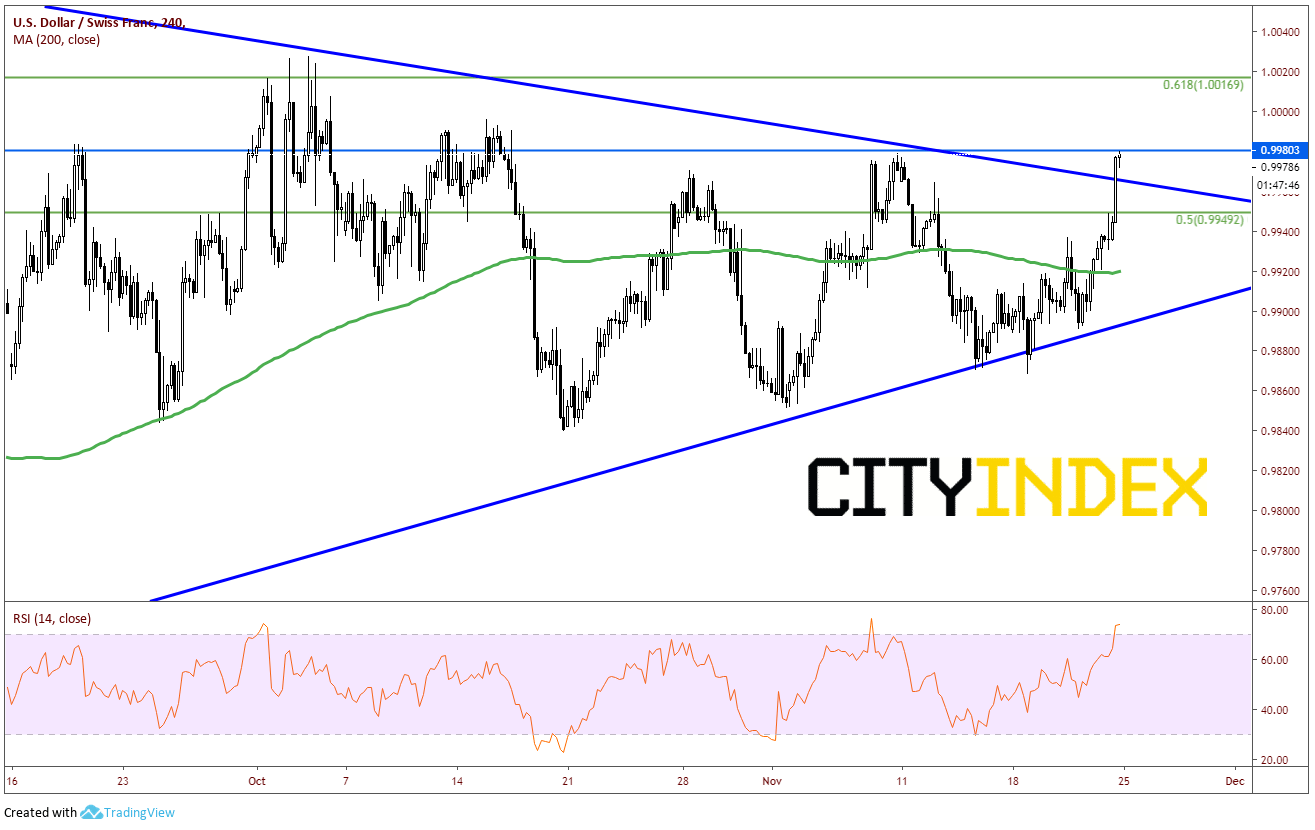
On a 240-minute chart, the RSI is in overbought conditions, and could be due for a pullback soon. .9950 is the 50% retracement level from the highs on April 25th to the lows on August 29th. This would be a nice area for price to pull back to as the RSI can unwind and USD/CHF can retest the trendline. The 200 Day Moving Average also comes in at that level. Below that, horizontal support comes in at .9820 and then the upward sloping trendline of the triangle near .9900. Resistance comes in at prior nears near the 61.8% retracement of the previously mentioned timeframe near 1.0017/1.0027. If USD/CHF trades above there, price can run as there is a lot of open space before horizontal resistance near 1.0130 (shown on daily).
Source: Tradingview, City Index
Now that USD/CHF is showing risk on, the question is whether stocks will follow. Stocks are near all-time highs but have been quiet the last few days. Watch for news over the weekend and gaps on the reopen Monday morning. If stocks move higher, USD/CHF may continue its move back towards parity.
Today is Friday. As we have seen in recent weeks, US President Trump likes talk on the US-China “deal in progress” on Fridays. Today was no different, as Trump earlier said that the China trade deal is coming along very well. Stocks have heard it too many times before and the S&P 500 is trading in a tight trading range for the day. But is that the reason the DXY was bid all day? Perhaps it was the delayed reaction to the US data this morning?
Source: Tradingview, FOREX.com
Regardless of the reason the move in DXY, USD/CHF is up nearly 0.5% on a day, whereas many other US Dollar pairs are trading in much tighter ranges. The USD/CHF is considered a directional indicator for the stock market. If USD/CHF moves higher, it is considered “risk on”. If the pair moves lower, it is considered “risk off”.
USD/CHF has been trading in a symmetrical triangle, as have other US Dollar pairs, since late April. As such, price has reached the apex and is coiling around the 200 Day Moving Average. However today is the sixth straight trading session that USD/CHF has closed higher. The pair busted through the 200 Day Moving Average closed above the descending trendline of the triangle for the first time at prior highs and horizontal resistance near .9980.
Source: Tradingview, FOREX.com
On a 240-minute chart, the RSI is in overbought conditions, and could be due for a pullback soon. .9950 is the 50% retracement level from the highs on April 25th to the lows on August 29th. This would be a nice area for price to pull back to as the RSI can unwind and USD/CHF can retest the trendline. The 200 Day Moving Average also comes in at that level. Below that, horizontal support comes in at .9820 and then the upward sloping trendline of the triangle near .9900. Resistance comes in at prior nears near the 61.8% retracement of the previously mentioned timeframe near 1.0017/1.0027. If USD/CHF trades above there, price can run as there is a lot of open space before horizontal resistance near 1.0130 (shown on daily).
Source: Tradingview, FOREX.com
Now that USD/CHF is showing risk on, the question is whether stocks will follow. Stocks are near all-time highs but have been quiet the last few days. Watch for news over the weekend and gaps on the reopen Monday morning. If stocks move higher, USD/CHF may continue its move back towards parity.
Latest market news




Open an account in minutes
Experience award-winning platforms with fast and secure execution.
Economic calendar
Web Trader platform
Our sophisticated web-based platform is packed with features.
Related articles
DXY, GBP/USD, AUD/USD, USD/CAD, USD/JPY, Gold Weekly Technical Outlook 11 16 2026
Sr. Technical Strategist Michael Boutros highlights the levels that matter on the USD Majors, commodities, and equity indices charts this week.
EUR/USD forecast: Dollar strength puts 1.1000 support in the spotlight | Currency Pair of the Week
The dollar extended its recent advance at the start of the week, with weakness across risk-sensitive assets reinforcing demand for the US currency. US equity futures slipped ahead of Nvidia’s earnings on Tuesday and an expected stock market debut by Anthropic later this week. Both events represent important tests for an AI trade that has become increasingly vulnerable to shifts in sentiment. In FX, EUR/USD nearly tested the psychologically important 1.1000 level, before bouncing modestly off its lows.


Nikkei swings harder than Nasdaq as AI fears deepen
Nikkei 225 volatility is running well ahead of Nasdaq 100, with the index construction and Japan's heavy exposure to AI manufacturing potentially explaining the difference.

StoneX Financial Ltd (trading as "FOREX.com") is an execution-only service provider. This material, whether or not it states any opinions, is for general information purposes only and it does not take into account your personal circumstances or objectives. This material has been prepared using the thoughts and opinions of the author and these may change. However, FOREX.com does not plan to provide further updates to any material once published and it is not under any obligation to keep this material up to date.
This material is short term in nature and may only relate to facts and circumstances existing at a specific time or day. Nothing in this material is (or should be considered to be) financial, investment, legal, tax or other advice and no reliance should be placed on it. No opinion given in this material constitutes a recommendation by FOREX.com or the author that any particular investment, security, transaction or investment strategy is suitable for any specific person.
The material has not been prepared in accordance with legal requirements designed to promote the independence of investment research. Although FOREX.com is not specifically prevented from dealing before providing this material, FOREX.com does not seek to take advantage of the material prior to its dissemination. This material is not intended for distribution to, or use by, any person in any country or jurisdiction where such distribution or use would be contrary to local law or regulation. For further details see our full non-independent research disclaimer and quarterly summary.