



USD/TRY lurches higher as traders question the central bank’s independence, 10.00 next?
Traders’ fears that the nominally independent central bank is becoming hopelessly politicized are being realized, causing a widespread loss of confidence in the lira...
Share this:

Perhaps for those used to trading the latest NFT or meme stock, the chart of USD/TRY may not look to unusual…but for FX traders, the ongoing collapse in the currency of a country in the top 20 of GDP is a truly astounding development.
What are Emerging Market economies?
Last week, my colleague Joe Perry identified the pair’s fresh record high on the back of geopolitical tensions and surging inflation, but the catalyst for the latest swoon in the lira is even more alarming. In a late-night decree on Thursday, Turkey’s President Recep Tayyip Erdogan dismissed several more of the central bank’s deputy governors, including the only one who opposed last month’s surprising interest rate cut.
In other words, traders’ fears that the nominally independent central bank is becoming hopelessly politicized are being realized, causing a widespread loss of confidence in the lira. According to central bank data, foreign investors held just $6B in government bonds at the halfway point of the year, down more than 90% from the $61.5B in Turkish bonds that foreign investors held as recently as 2013.
Trade USD/TRY now: Login or open a new account!
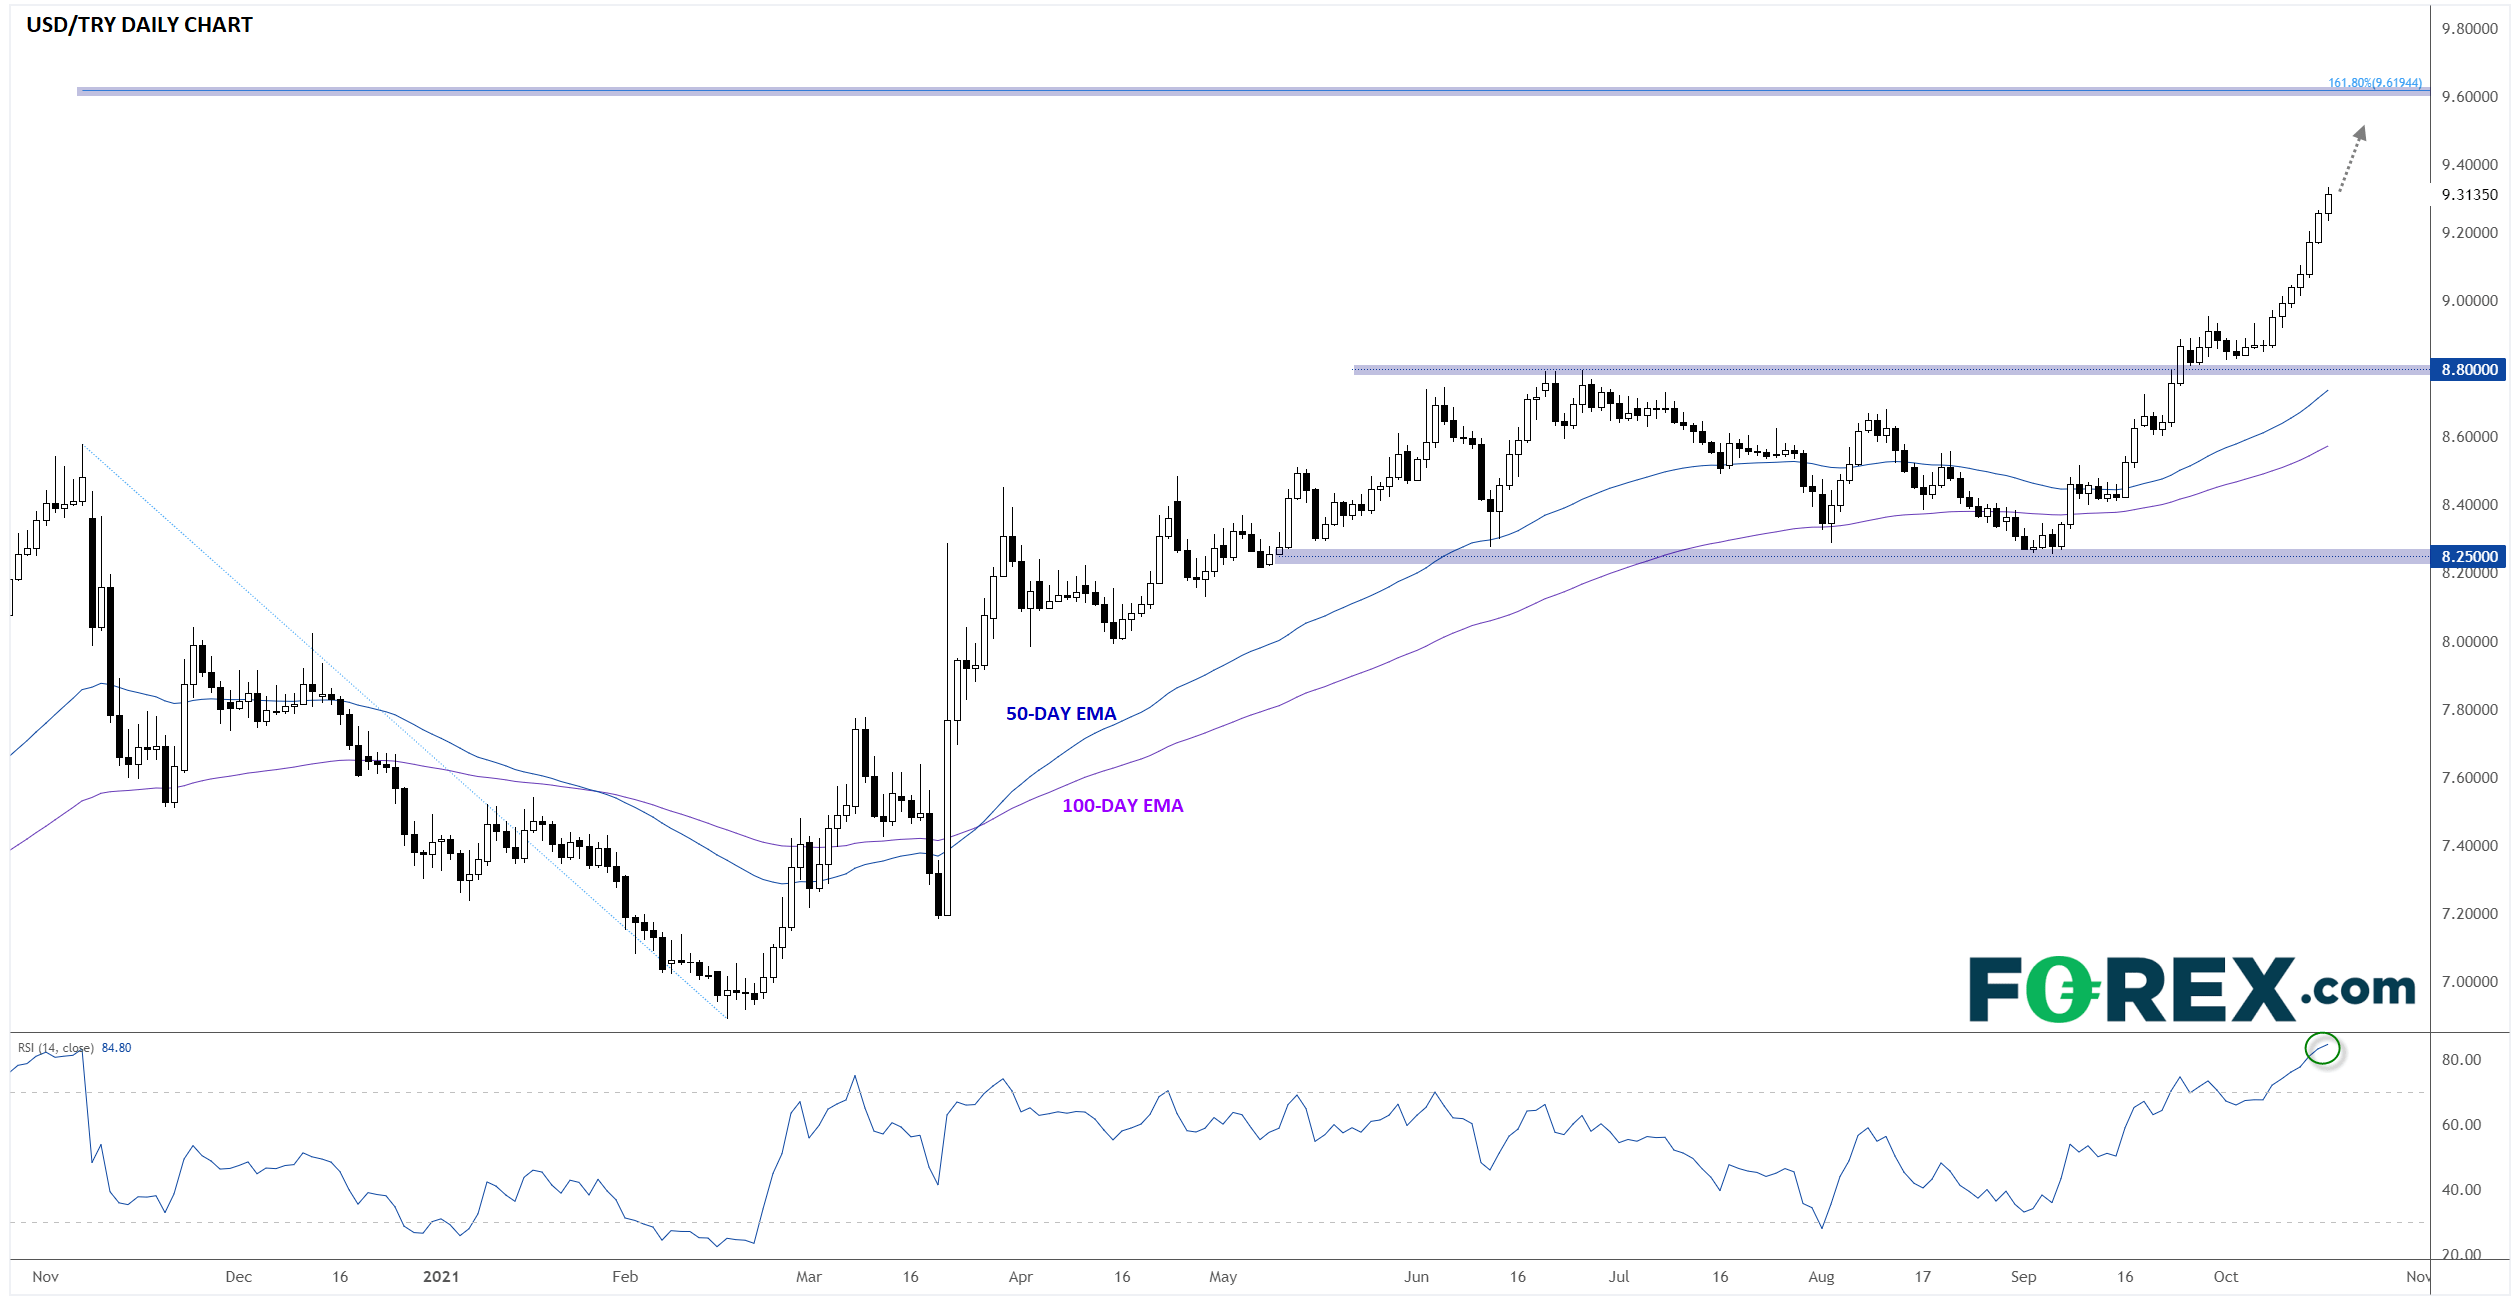
Turning our attention to the chart, USD/TRY is working on its seventh consecutive daily gain after blasting through the 9.00 level last week. With prices at a fresh record high, there are no levels of previous resistance nearby, though the 161.8% Fibonacci extension of the 3-month pullback that started this time last year looms up near 9.60 as a logical next target for bulls. Beyond that, the psychologically-significant 10.00 level may come into play next.
Source: StoneX, TradingView
It is notable that the 14-day RSI indicator is above 80, at an area that has previous marked short-term peaks in the USD/TRY exchange rate. That said, the country’s economic and monetary policy outlook hasn’t been this precarious before, so rates could certainly continue to surge regardless of an overbought reading on a technical indicator.
The next hurdle for the beleaguered currency is another CBRT monetary policy meeting on Thursday. Based on last week’s actions and the recent price action, investors a bracing for another interest rate cut, further deterioration in the value of the lira, and continued inflation in the country.
How to trade with FOREX.com
Follow these easy steps to start trading with FOREX.com today:
- Open a Forex.com account, or log-in if you’re already a customer.
- Search for the pair you want to trade in our award-winning platform.
- Choose your position and size, and your stop and limit levels.
- Place the trade.
Perhaps for those used to trading the latest NFT or meme stock, the chart of USD/TRY may not look to unusual…but for FX traders, the ongoing collapse in the currency of a country in the top 20 of GDP is a truly astounding development.
What are Emerging Market economies?
Last week, my colleague Joe Perry identified the pair’s fresh record high on the back of geopolitical tensions and surging inflation, but the catalyst for the latest swoon in the lira is even more alarming. In a late-night decree on Thursday, Turkey’s President Recep Tayyip Erdogan dismissed several more of the central bank’s deputy governors, including the only one who opposed last month’s surprising interest rate cut.
In other words, traders’ fears that the nominally independent central bank is becoming hopelessly politicized are being realized, causing a widespread loss of confidence in the lira. According to central bank data, foreign investors held just $6B in government bonds at the halfway point of the year, down more than 90% from the $61.5B in Turkish bonds that foreign investors held as recently as 2013.
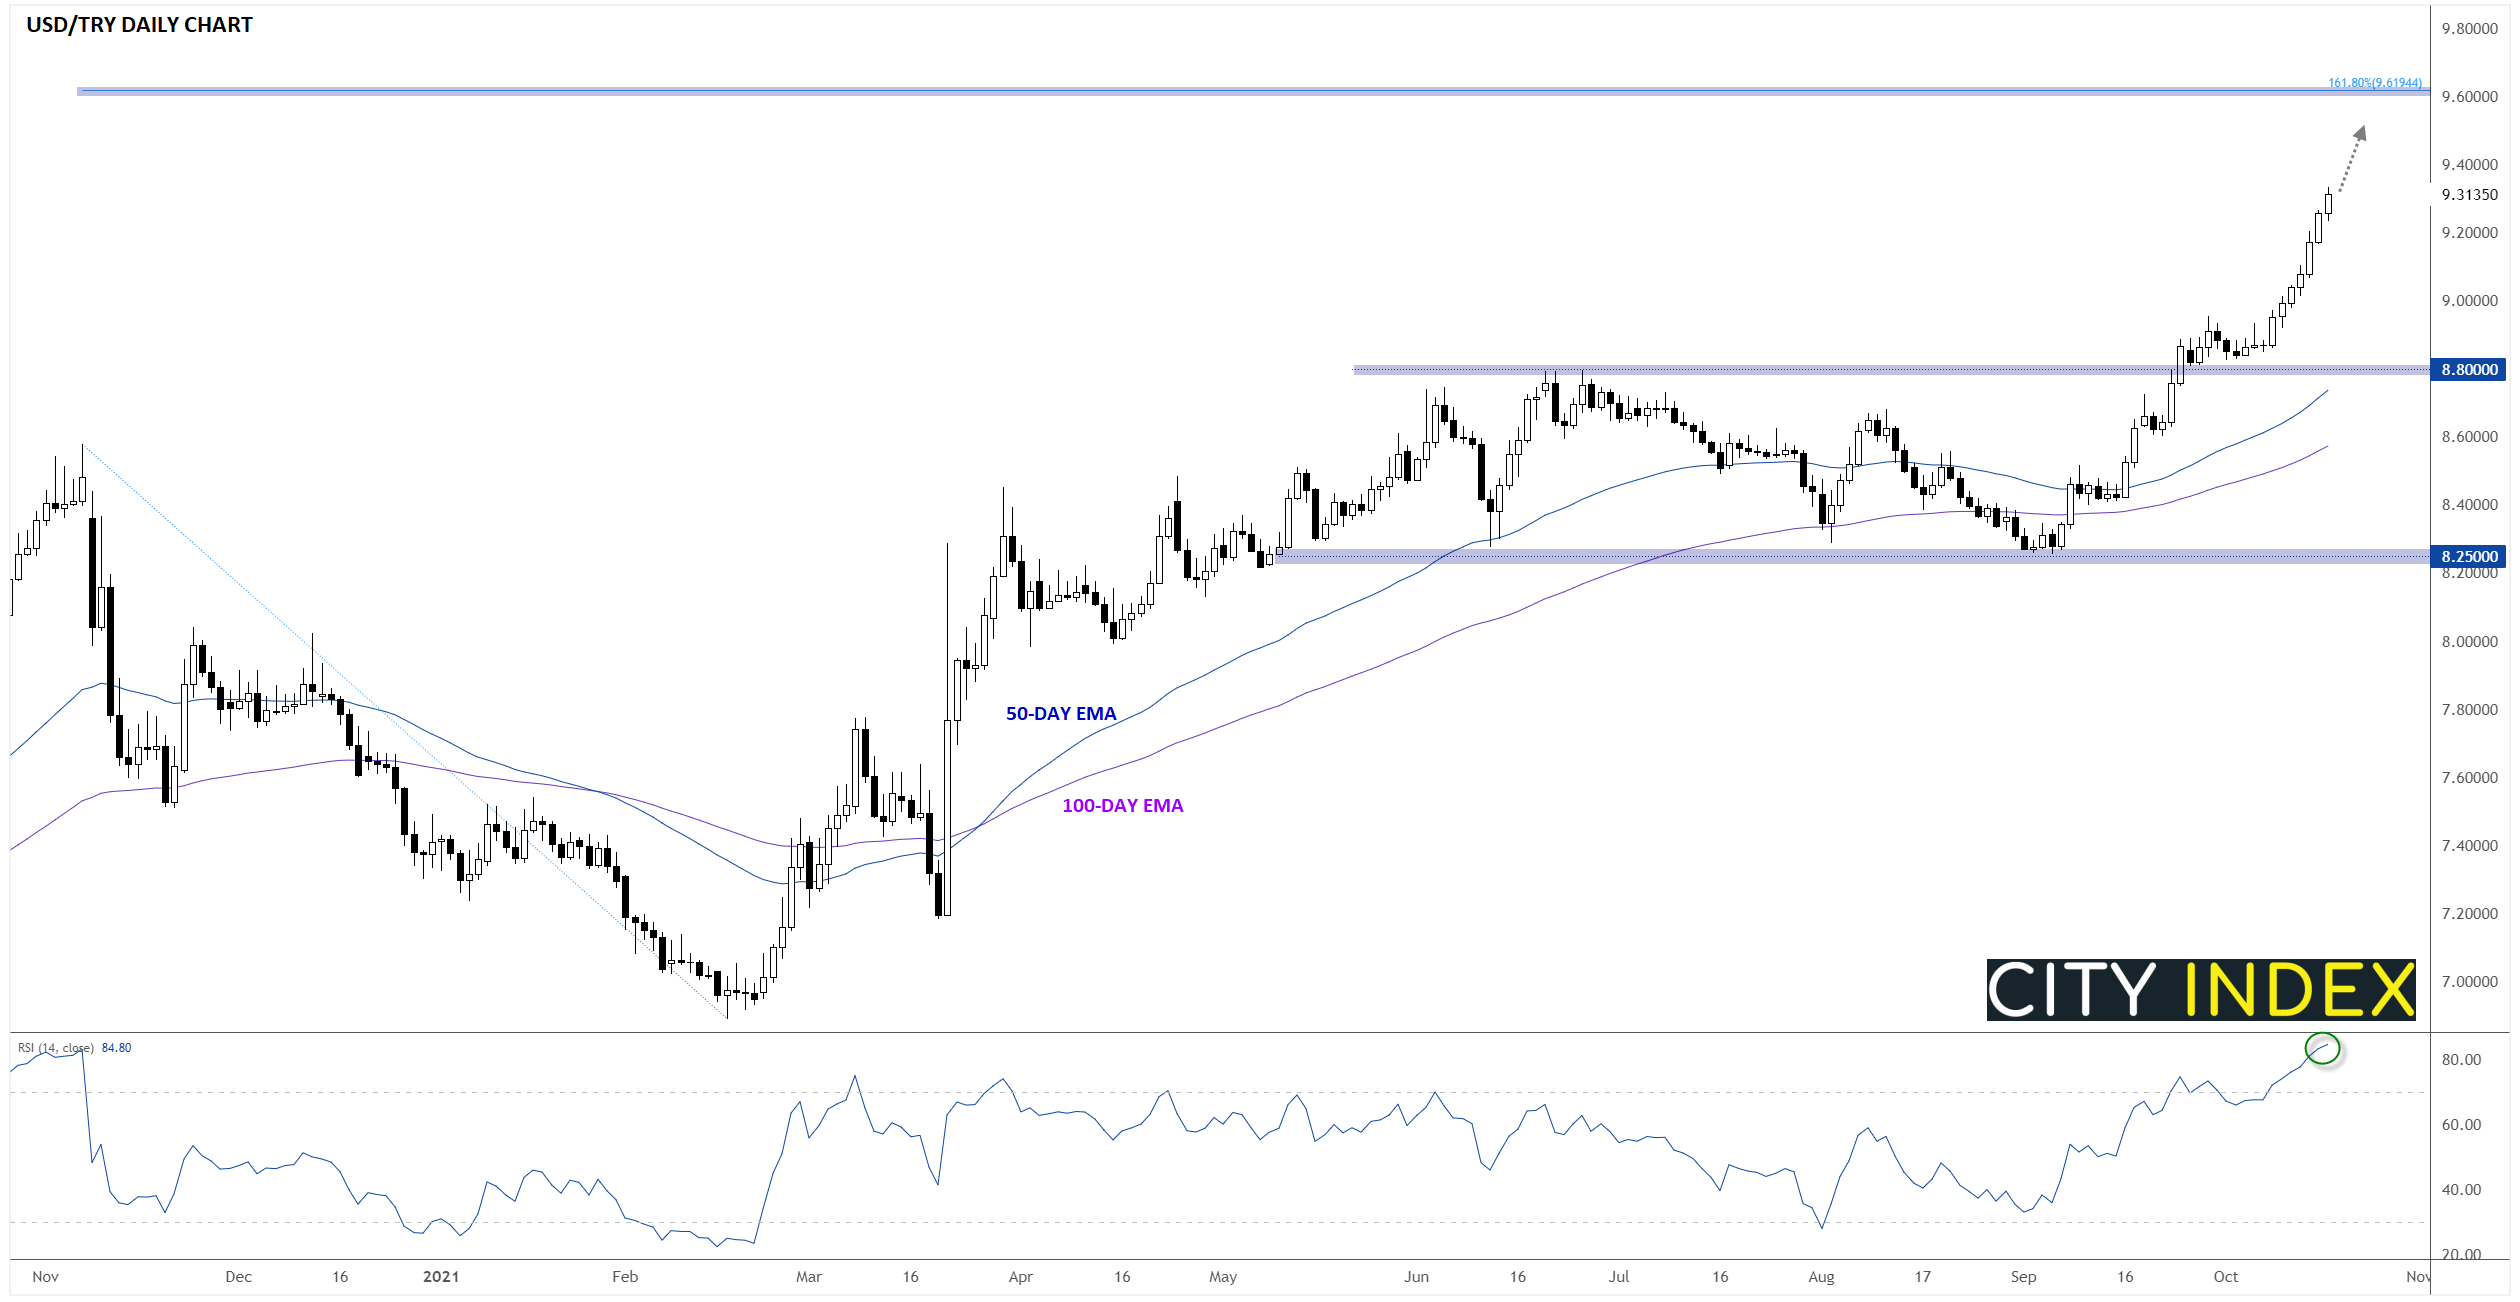
Turning our attention to the chart, USD/TRY is working on its seventh consecutive daily gain after blasting through the 9.00 level last week. With prices at a fresh record high, there are no levels of previous resistance nearby, though the 161.8% Fibonacci extension of the 3-month pullback that started this time last year looms up near 9.60 as a logical next target for bulls. Beyond that, the psychologically-significant 10.00 level may come into play next.
Source: StoneX, TradingView
It is notable that the 14-day RSI indicator is above 80, at an area that has previous marked short-term peaks in the USD/TRY exchange rate. That said, the country’s economic and monetary policy outlook hasn’t been this precarious before, so rates could certainly continue to surge regardless of an overbought reading on a technical indicator.
The next hurdle for the beleaguered currency is another CBRT monetary policy meeting on Thursday. Based on last week’s actions and the recent price action, investors a bracing for another interest rate cut, further deterioration in the value of the lira, and continued inflation in the country.
How to trade with City Index
You can trade easily trade with City Index by using these four easy steps:
- Open an account, or log in if you’re already a customer
• Open an account in the UK
• Open an account in Australia
• Open an account in Singapore
- Search for the company you want to trade in our award-winning platform
- Choose your position and size, and your stop and limit levels
- Place the trade
Latest market news




Open an account in minutes
Experience award-winning platforms with fast and secure execution.
Economic calendar
Web Trader platform
Our sophisticated web-based platform is packed with features.
Related articles
NZD/USD Forecast: Kiwi faces historic breakdown as RBNZ survey looms
NZD/USD is teetering above support that held through the pandemic and Liberation Day turmoil. With RBNZ hawks repeatedly disappointed, today's inflation expectations survey could open the door to a slide towards the GFC lows.
USD/JPY, AUD/JPY: Central Bank Divergence Creates Two-Way Risk
USD/JPY eyes a breakout above 160, while AUD/JPY faces further losses as Fed, RBA and BoJ interest rate expectations diverge.

DXY, GBP/USD, AUD/USD, USD/CAD, USD/JPY, Gold Weekly Technical Outlook 11 16 2026
Sr. Technical Strategist Michael Boutros highlights the levels that matter on the USD Majors, commodities, and equity indices charts this week.

StoneX Financial Ltd (trading as "FOREX.com") is an execution-only service provider. This material, whether or not it states any opinions, is for general information purposes only and it does not take into account your personal circumstances or objectives. This material has been prepared using the thoughts and opinions of the author and these may change. However, FOREX.com does not plan to provide further updates to any material once published and it is not under any obligation to keep this material up to date.
This material is short term in nature and may only relate to facts and circumstances existing at a specific time or day. Nothing in this material is (or should be considered to be) financial, investment, legal, tax or other advice and no reliance should be placed on it. No opinion given in this material constitutes a recommendation by FOREX.com or the author that any particular investment, security, transaction or investment strategy is suitable for any specific person.
The material has not been prepared in accordance with legal requirements designed to promote the independence of investment research. Although FOREX.com is not specifically prevented from dealing before providing this material, FOREX.com does not seek to take advantage of the material prior to its dissemination. This material is not intended for distribution to, or use by, any person in any country or jurisdiction where such distribution or use would be contrary to local law or regulation. For further details see our full non-independent research disclaimer and quarterly summary.