



Will equity market contagion spread to FX? USDJPY and GBPUSD
The woes of Wall Street deepened overnight, and after another session of heavy losses, the S&P500 is trading back at levels last seen in April last year.
Share this:

The woes of Wall Street deepened overnight, and after another session of heavy losses, the S&P500 is trading back at levels last seen in April last year.
Signs of contagion into other asset classes have been relatively limited so far despite the S&P500s 17% fall. There are concerns that if the equity market falls much further, it will lead to position reduction in other asset classes, particularly in those markets where positioning is the most acute.
In that respect, the FX market has two obvious contenders, the JPY and GBP, with investors heavily short both against the U.S dollar.
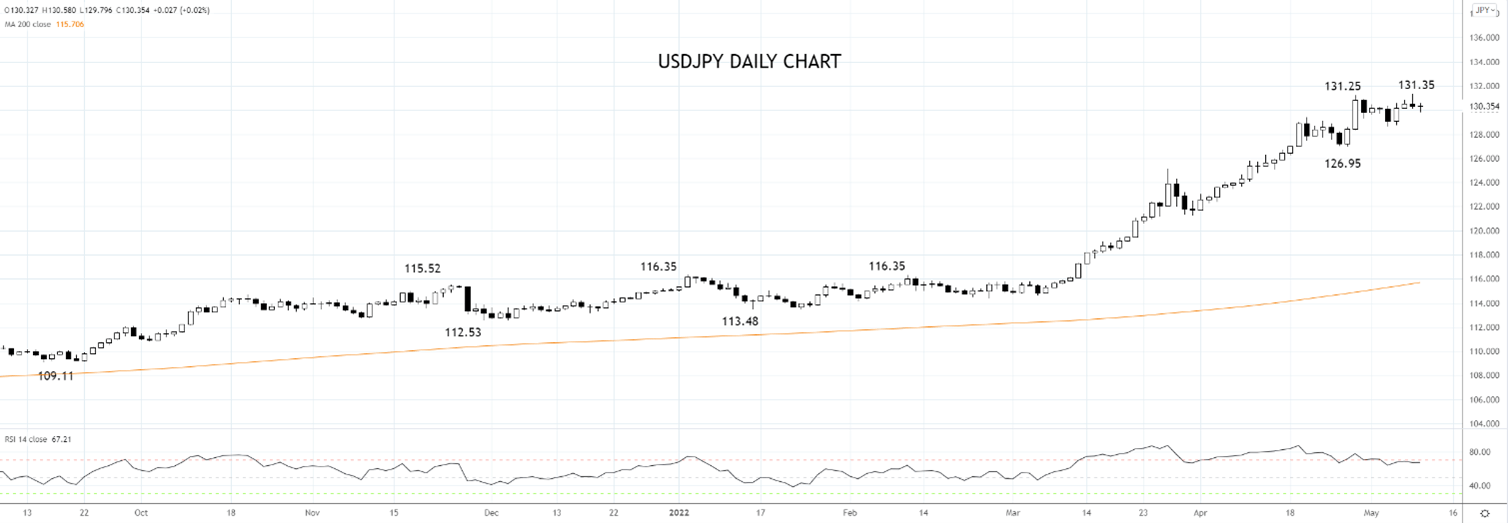
Notably, the eye-watering rally in USDJPY during March and April has stalled in May and overnight, USDJPY closed lower on the back of a retracement in U.S. yields and risk aversion buying of Yen.
While we are the first to acknowledge that fundamentally USDJPY remains supported by the monetary policy divergence of a hawkish Federal Reserve contrasted with a dovish Bank of Japan, the technical picture has clouded.
Firstly, in the form of a loss of momentum candle that formed overnight at the 131.25 high. Secondly, the bearish divergence has become more pronounced via the RSI indicator. Finally, the overbought nature of the rally and the stretched positioning suggests that if contagion does creep into the FX market, a pullback to 127.00 in USDJPY looks relatively achievable.
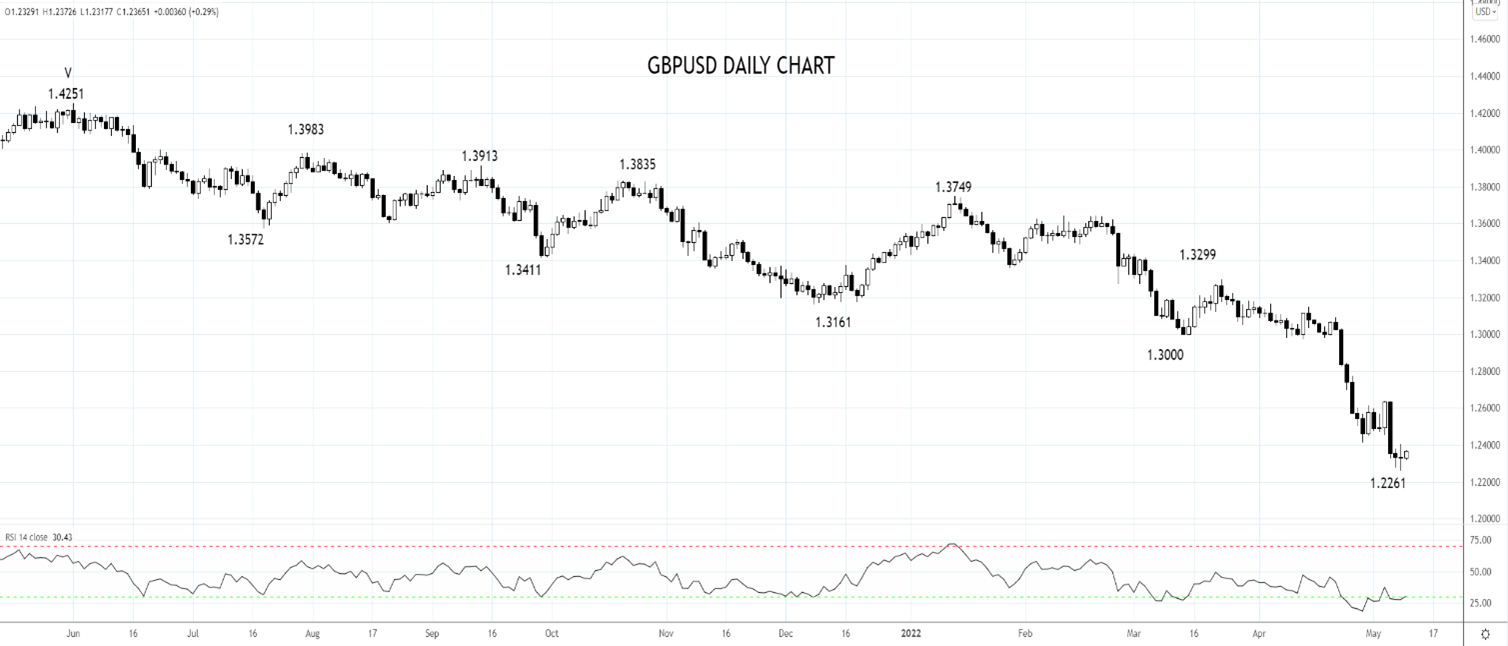
Turning to GBPUSD, there is a similar technical set-up to the one in USDJPY, including a loss of momentum type candle evident at last night's 1.2261 low, signs of bullish divergence on the RSI indicator. On the first hint of contagion and despite the bearish macro backdrop, a rally back to last week's 1.2640 high seems achievable.
Source Tradingview. The figures stated are as of May 10, 2022. Past performance is not a reliable indicator of future performance. This report does not contain and is not to be taken as containing any financial product advice or financial product recommendation
How to trade with City Index
You can trade with City Index by following these four easy steps:
- Open an account, or log in if you’re already a customer
• Open an account in the UK
• Open an account in Australia
• Open an account in Singapore
- Search for the company you want to trade in our award-winning platform
- Choose your position and size, and your stop and limit levels
- Place the trade
The woes of Wall Street deepened overnight, and after another session of heavy losses, the S&P500 is trading back at levels last seen in April last year.
Signs of contagion into other asset classes have been relatively limited so far despite the S&P500s 17% fall. There are concerns that if the equity market falls much further, it will lead to position reduction in other asset classes, particularly in those markets where positioning is the most acute.
In that respect, the FX market has two obvious contenders, the JPY and GBP, with investors heavily short both against the U.S dollar.
Notably, the eye-watering rally in USDJPY during March and April has stalled in May and overnight, USDJPY closed lower on the back of a retracement in U.S. yields and risk aversion buying of Yen.
While we are the first to acknowledge that fundamentally USDJPY remains supported by the monetary policy divergence of a hawkish Federal Reserve contrasted with a dovish Bank of Japan, the technical picture has clouded.
Firstly, in the form of a loss of momentum candle that formed overnight at the 131.25 high. Secondly, the bearish divergence has become more pronounced via the RSI indicator. Finally, the overbought nature of the rally and the stretched positioning suggests that if contagion does creep into the FX market, a pullback to 127.00 in USDJPY looks relatively achievable.
Turning to GBPUSD, there is a similar technical set-up to the one in USDJPY, including a loss of momentum type candle evident at last night's 1.2261 low, signs of bullish divergence on the RSI indicator. On the first hint of contagion and despite the bearish macro backdrop, a rally back to last week's 1.2640 high seems achievable.
Source Tradingview. The figures stated are as of May 10, 2022. Past performance is not a reliable indicator of future performance. This report does not contain and is not to be taken as containing any financial product advice or financial product recommendation
- Open a Forex.com account, or log in if you’re already a customer.
- Search for the pair you want to trade in our award-winning platform.
- Choose your position and size, and your stop and limit levels.
- Place the trade.
Related tags:

Open an account in minutes
Experience award-winning platforms with fast and secure execution.
Economic calendar
Web Trader platform
Our sophisticated web-based platform is packed with features.
Related articles

NZD/USD Forecast: Kiwi faces historic breakdown as RBNZ survey looms
NZD/USD is teetering above support that held through the pandemic and Liberation Day turmoil. With RBNZ hawks repeatedly disappointed, today's inflation expectations survey could open the door to a slide towards the GFC lows.

USD/JPY, AUD/JPY: Central Bank Divergence Creates Two-Way Risk
USD/JPY eyes a breakout above 160, while AUD/JPY faces further losses as Fed, RBA and BoJ interest rate expectations diverge.


DXY, GBP/USD, AUD/USD, USD/CAD, USD/JPY, Gold Weekly Technical Outlook 11 16 2026
Sr. Technical Strategist Michael Boutros highlights the levels that matter on the USD Majors, commodities, and equity indices charts this week.

StoneX Financial Ltd (trading as "FOREX.com") is an execution-only service provider. This material, whether or not it states any opinions, is for general information purposes only and it does not take into account your personal circumstances or objectives. This material has been prepared using the thoughts and opinions of the author and these may change. However, FOREX.com does not plan to provide further updates to any material once published and it is not under any obligation to keep this material up to date.
This material is short term in nature and may only relate to facts and circumstances existing at a specific time or day. Nothing in this material is (or should be considered to be) financial, investment, legal, tax or other advice and no reliance should be placed on it. No opinion given in this material constitutes a recommendation by FOREX.com or the author that any particular investment, security, transaction or investment strategy is suitable for any specific person.
The material has not been prepared in accordance with legal requirements designed to promote the independence of investment research. Although FOREX.com is not specifically prevented from dealing before providing this material, FOREX.com does not seek to take advantage of the material prior to its dissemination. This material is not intended for distribution to, or use by, any person in any country or jurisdiction where such distribution or use would be contrary to local law or regulation. For further details see our full non-independent research disclaimer and quarterly summary.