

It was a brutal day for the risk trade yesterday and that perhaps showed most clearly in Bitcoin, which pushed down for a re-test of the 100k level for the first time since June. That prior episode was followed by a strong bullish response and so far we’ve seen a repeat of that. In the prior instance, the rally ran all the way to fresh all-time-highs and the initial test of 120k, which eventually stalled the rally. So, seeing another reaction at such a major psychological level on a pullback makes sense if you think of the institutions that might’ve been waiting for a dip to add to allocations. But, the bigger question now is whether longs that are still holding will use this bounce to trim exposure in anticipation of a deeper pullback; or whether buyers show up to continue defending Bitcoin at or just above the 100k figure to set up for a bullish trend that can ultimately re-test the 120k or perhaps even 125k level.

On a short-term basis, there was even the build of a bullish reversal setup with that test below 100k. Price touched down to a low just inside of 99k on two separate occasions and that set up a double bottom pattern. The neckline plotted at 101,833, and the projected move from the pattern plots just overhead, around prior resistance of 104,768. That’s now become a major spot for the short-term up-trend to be tested, and if we do see bulls drive through with a push above the 105k handle, the prospect of Bitcoin having set a near-term bottom will start to take on greater attraction.
Bitcoin 30-Minute Price Chart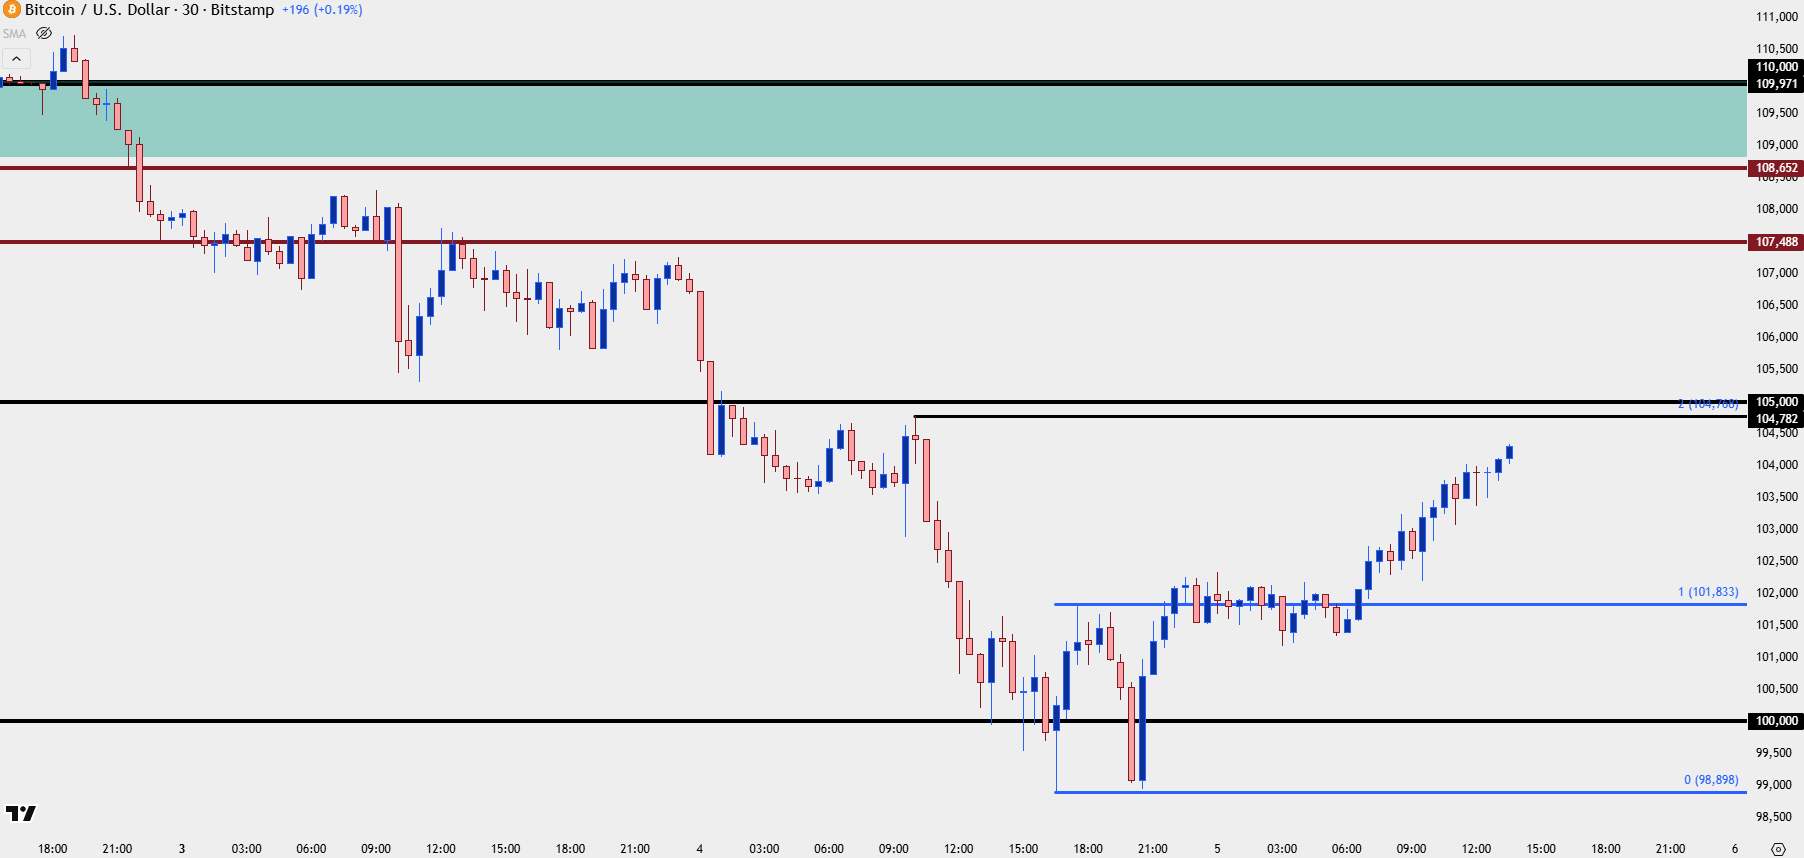
Chart prepared by James Stanley; data derived from Tradingview
Bitcoin Big Figure Defense
That 105k level was a spot of defense a couple of weeks ago, riding on the wave of weakness driven by the Trump tariff threat from a week prior. You can see a similar bounce at 110k from the prior week, which was cut short at 115k at which point sellers went back in; and that led to the drive and bounce at 105k which, again, saw a rally develop until a 115k test.
And then more recently, earlier this week, the 110k level started to elicit sellers, which brought a dramatic drop leading into last night’s test of 100k.
The point of highlighting this is that since that 125k resistance in early-October, sellers have been using bounces to lighten exposure, and that’s the fear at this point, that the 100k bounce that’s shown vigorously on short-term charts becomes another sellable opportunity for longs and it’s the 105k and then 110k levels that stand out on this theme.
Bitcoin Daily Chart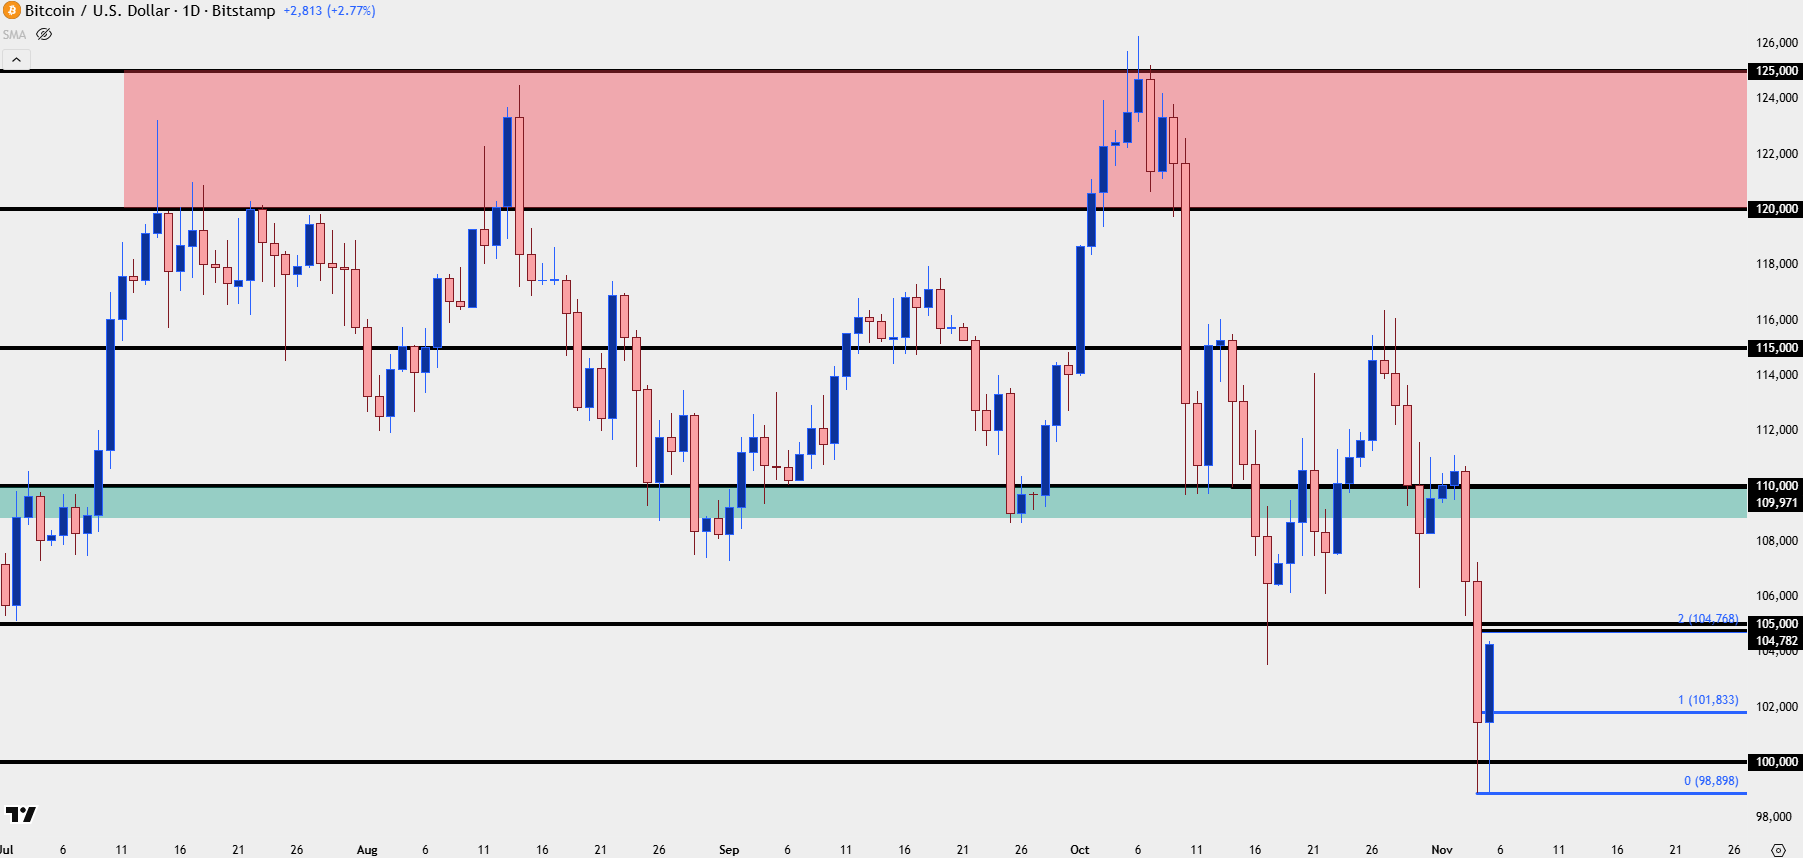
Chart prepared by James Stanley; data derived from Tradingview
Bitcoin Near-Term Strategy
Given recent structure where volatility has been rather high, the chart can be imposing for setting up swings. But, from shorter-term analysis the prospect of near-term trends becomes a bit more attractive, and that’s where the 105k zone stands out as a break above that could highlight an oncoming bullish trend.
I also wanted to highlight the prior instance at 100k as that major psychological level stands out as a place of importance, and that previous instance illustrates well how a test around that price can change the flow and ultimately the trend. In the red box below, sellers were in full control with both lower-lows and lower-highs. But it was after the brief test below 100k that buyers started to take back over, with a quick shot back up to 105k followed by a rally into prior resistance at 110k. At that point the two boxes made for an inverse head and shoulders pattern and that broke out with aggression shortly after a higher-low came in following the 110k resistance test (shown with purple box).
Bitcoin Four-Hour Chart (June 7 - July 12, 2025)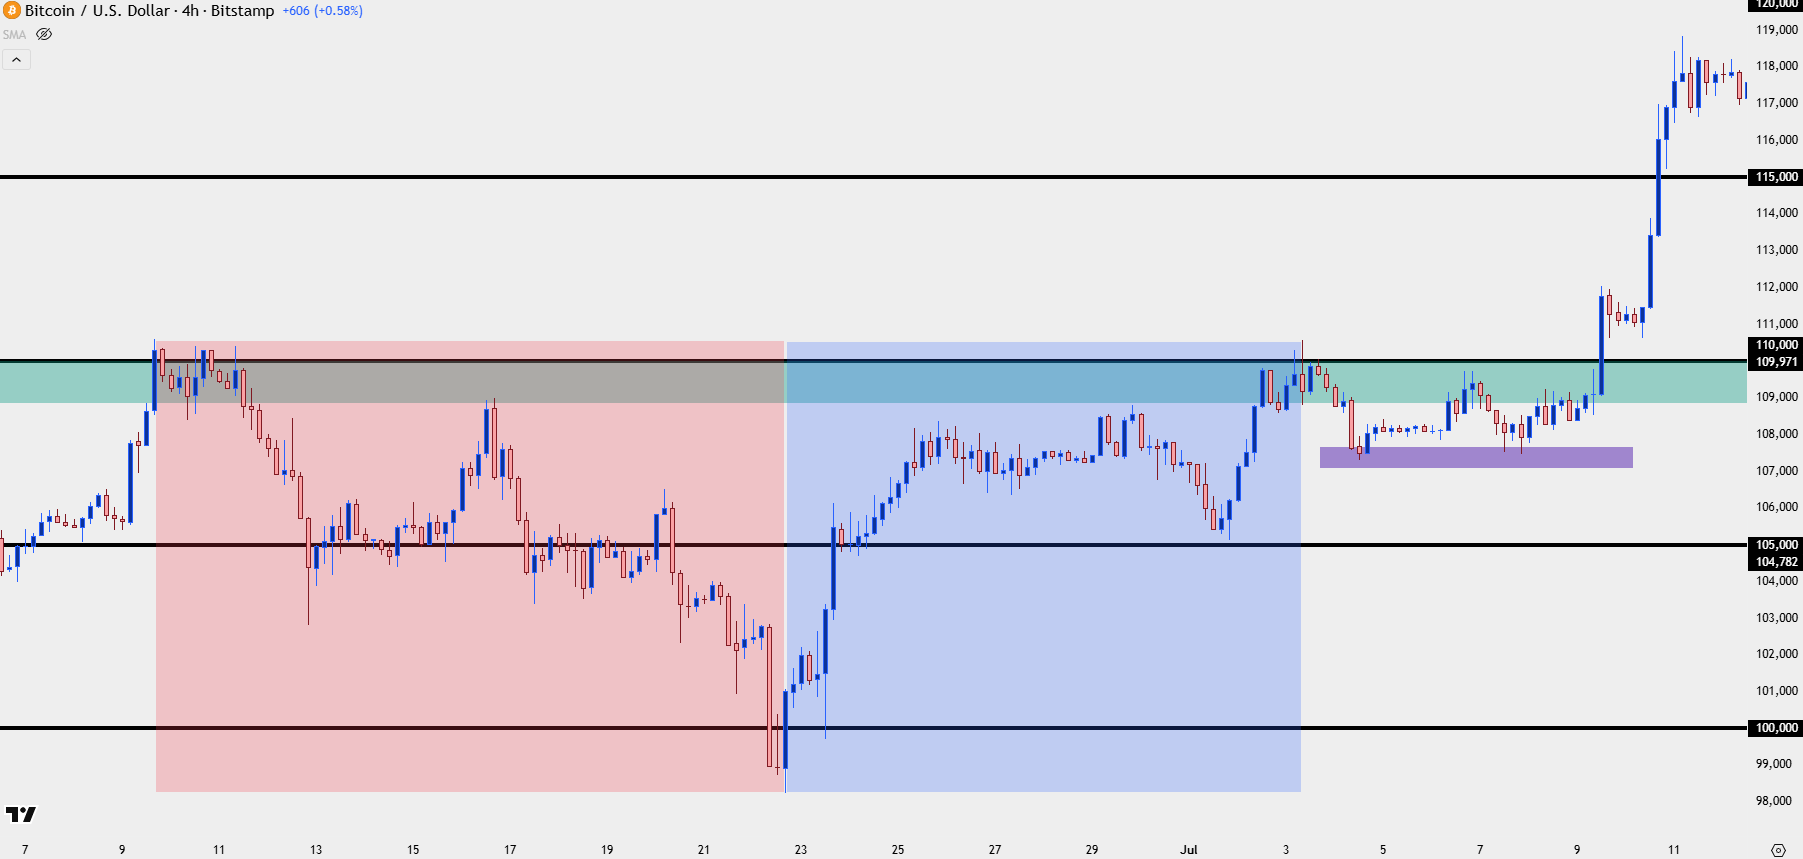
Chart prepared by James Stanley; data derived from Tradingview
Bitcoin Four-Hour
At this point, the current four-hour chart still retains a bearish touch given the lower-lows and lower-highs and all that we can match with the prior scenario above is the 100k test. But if bulls can foce back above 105k that’ll be indication that there’s an open door for more, with 110k as the next big spot and then 115k and 120k thereafter. Chasing short-term trends can prove challenging, so, as we can see from the prior scenario above, waiting for a pullback and show of support after a test at one of these big figures can represent a pullback with which buyers can look for topside continuation.
Bitcoin Four-Hour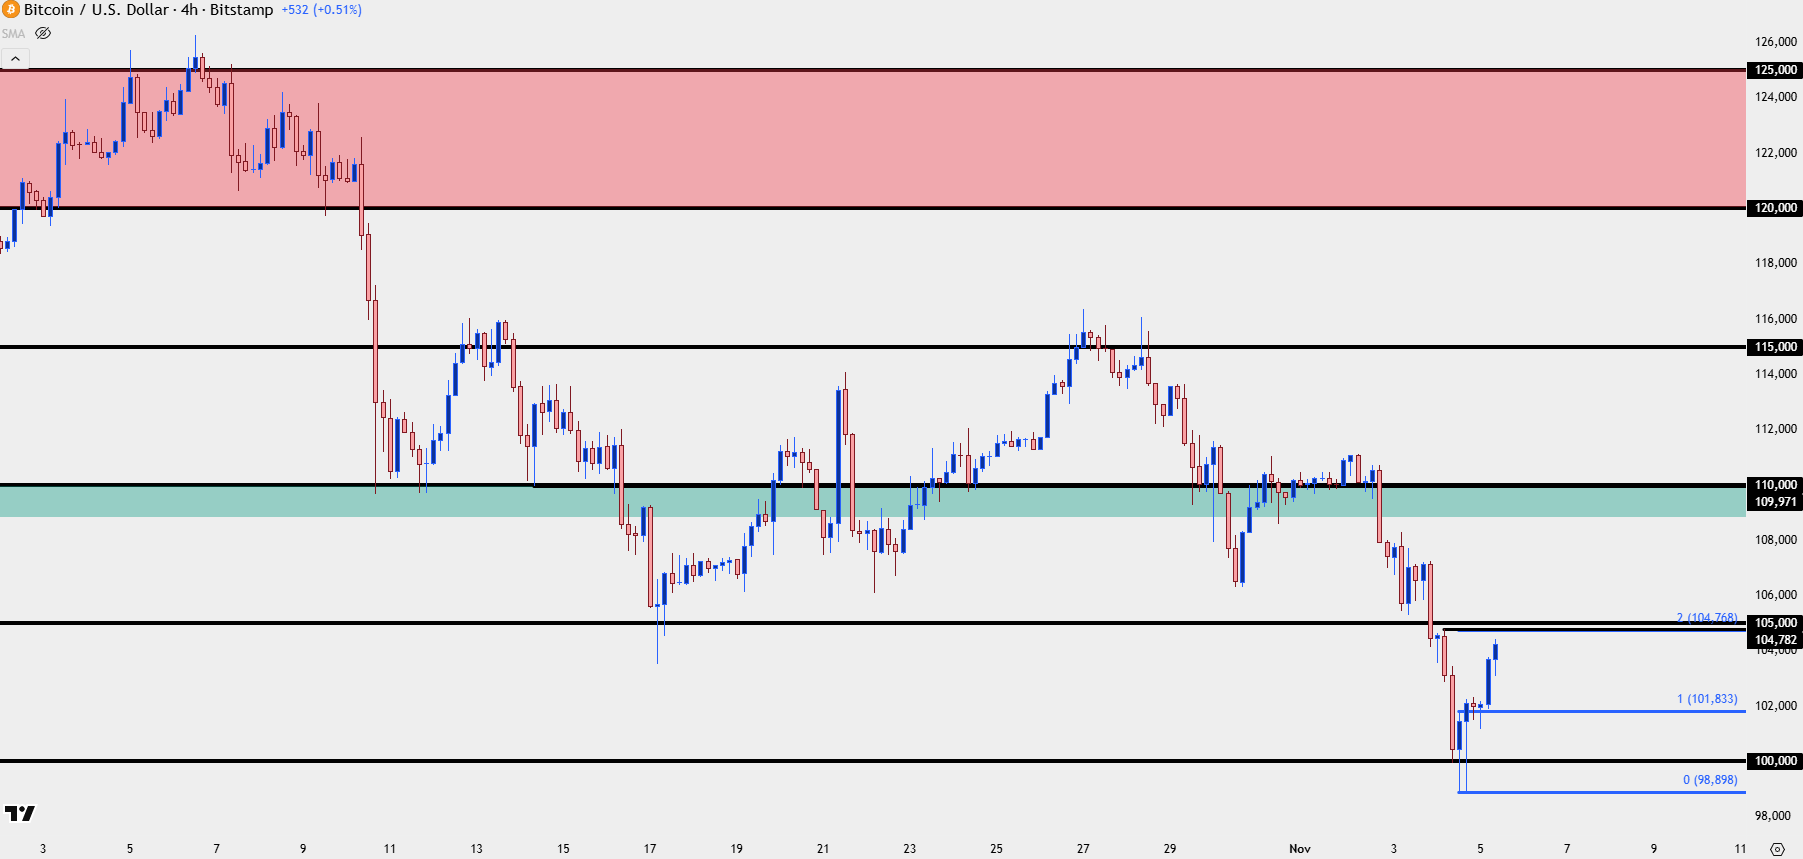
Chart prepared by James Stanley; data derived from Tradingview
--- written by James Stanley, Senior Market Analyst, Global Macro