
The trading week has not been entirely positive for Bitcoin price action. Now, BTC is posting a three-session bearish streak in the short term and is recording a decline of around 3.00%, which has started to reflect a new relevant selling bias in recent price action.
At this point, the loss of strength may have started to become more evident in the market as activity within the BTC network shows signs of slowing down, which could point to a short-term profit-taking effect. In addition, a stronger bond market outlook may also have started to affect appetite for risk assets such as Bitcoin. If these factors remain in place, selling pressure may continue to be relevant in the coming sessions.

Is demand starting to weaken?
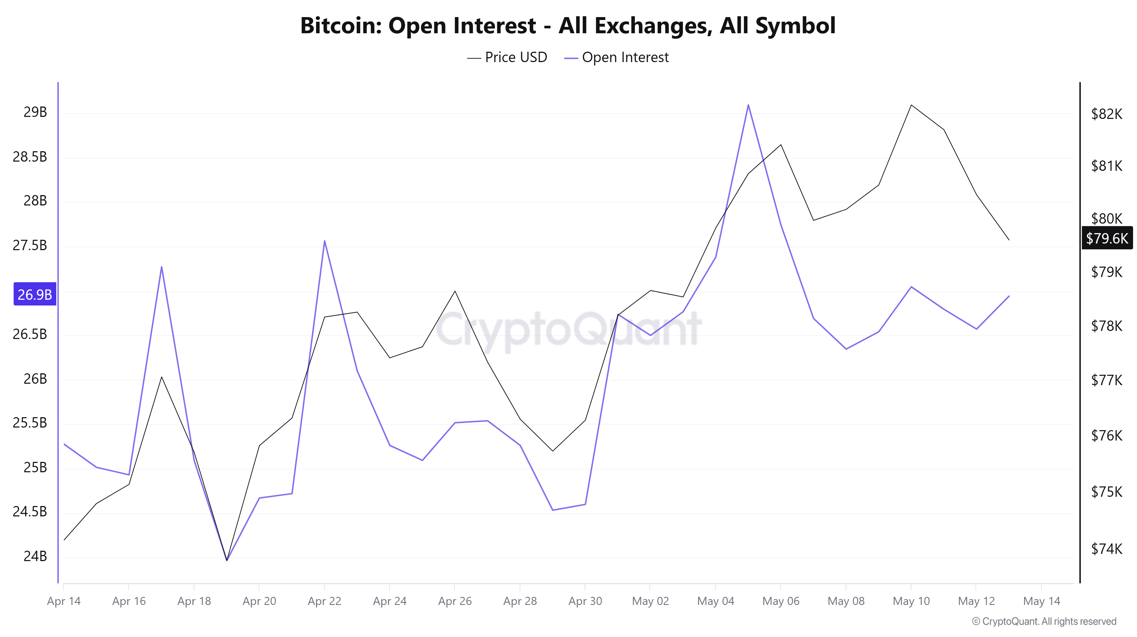
In recent trading sessions, an interesting behavior has started to appear in Bitcoin’s Open Interest indicator, which measures the total number of open positions, both long and short, in the market. Over the last few sessions, this indicator has shown a slight increase toward the area near $27 billion in open positions, according to figures from May 12.
What is important to consider is that this slight increase in Open Interest has been accompanied by a consistent decline in BTC’s price. This suggests that the increase in the indicator may not be mainly related to the entry of new long positions, but rather to the addition of some short positions in the market. As a result, demand appears to be facing a weakening dynamic that is starting to become relevant within recent Open Interest movements.
Source: CryptoQuant
Activity within the BTC market could be showing a consistent weakening dynamic in price, possibly linked to profit-taking around the psychological 80k area. This type of behavior tends to occur when price remains near relevant levels and has been part of similar price action in the past. At this point, this dynamic could be reflecting a reduction in demand strength in the short term.
Taking all of this into account, it is important to keep in mind that weakness could become more pronounced if Open Interest continues to increase while price keeps moving lower. This behavior would show more consistently that selling pressure is accumulating positions in the short term, which could mean that downside pressure remains relevant in the coming trading sessions.
Is the bond market still applying pressure?
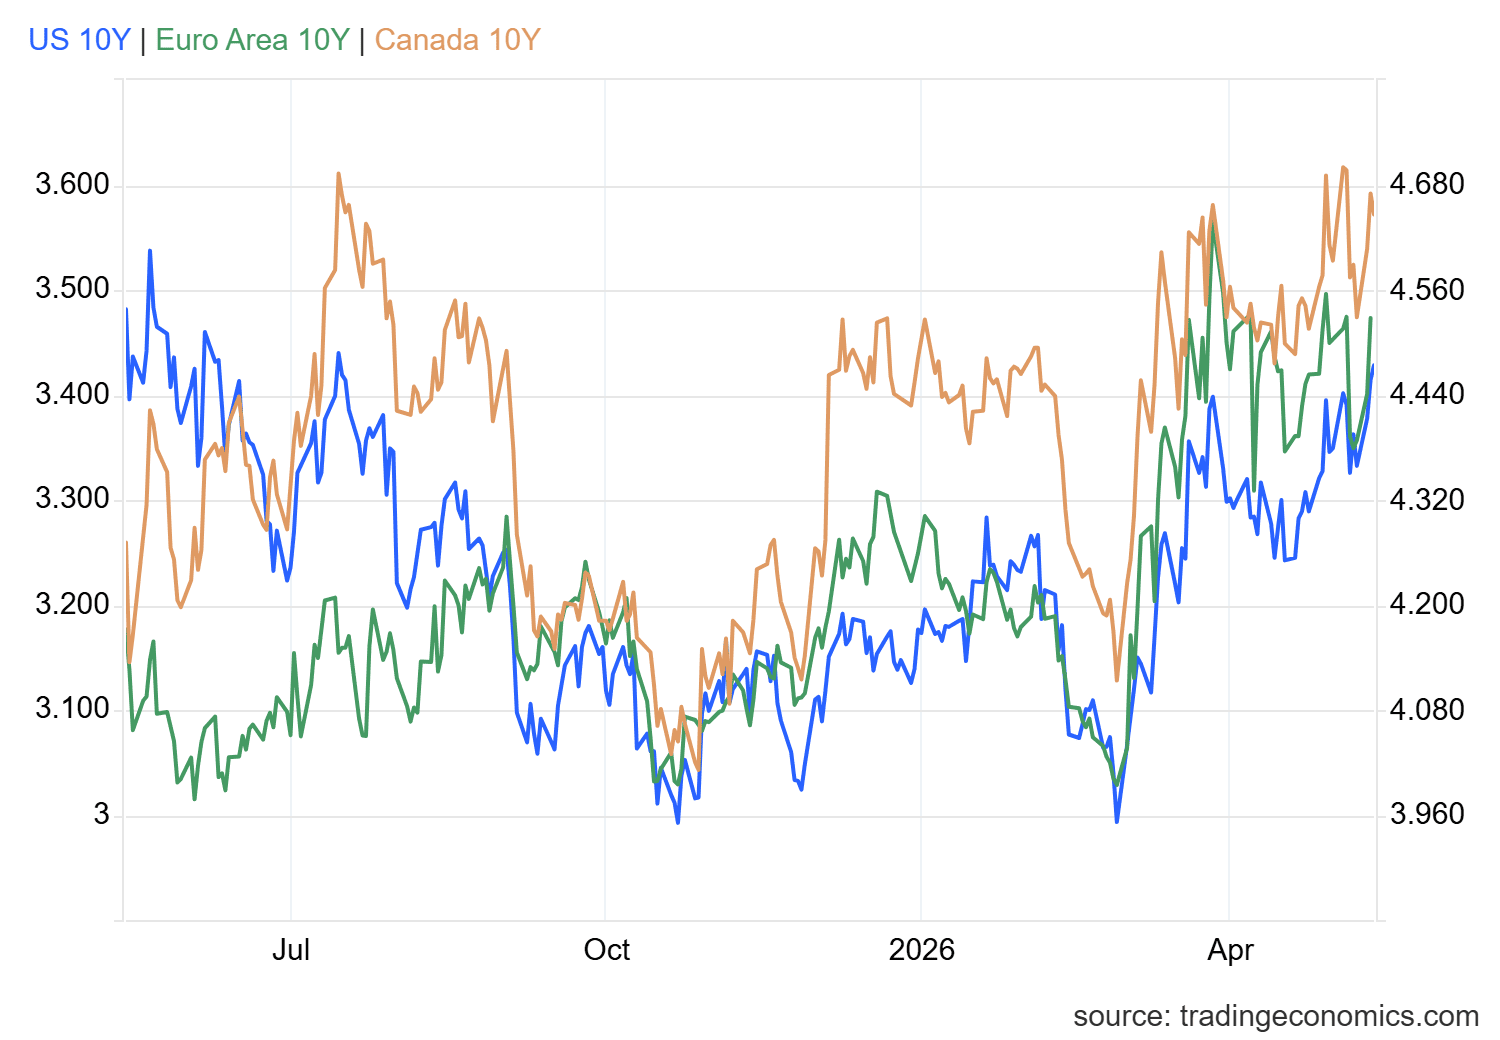
Another relevant event across markets has to do with the strengthening appeal of the bond market in the short term. Now, the US 10-year yield remains near the 4.5% level, while in Europe it is approaching 3.5% and in Canada it is around the 3.6% area. The general dynamic across these instruments is similar, as yields continue to show consistent increases as trading sessions move forward, maintaining a stable upward slope for now.
Source: TradingEconomics
This behavior in the bond market may also be counterproductive for a consistent advance in Bitcoin. As the fixed income market begins to show greater appeal, it could attract capital toward instruments that offer fixed yields, reducing the amount of capital available for risk assets in the short term, such as Bitcoin.
In this scenario, a macroeconomic effect of lower exposure to non-traditional risk markets, such as cryptocurrencies, could also be forming. This dynamic may continue as long as the recovery in bond yields remains constant in the short term, which could also highlight relevant weakness in Bitcoin price action during the coming sessions.
Technical outlook for Bitcoin
Source: StoneX, Tradingview
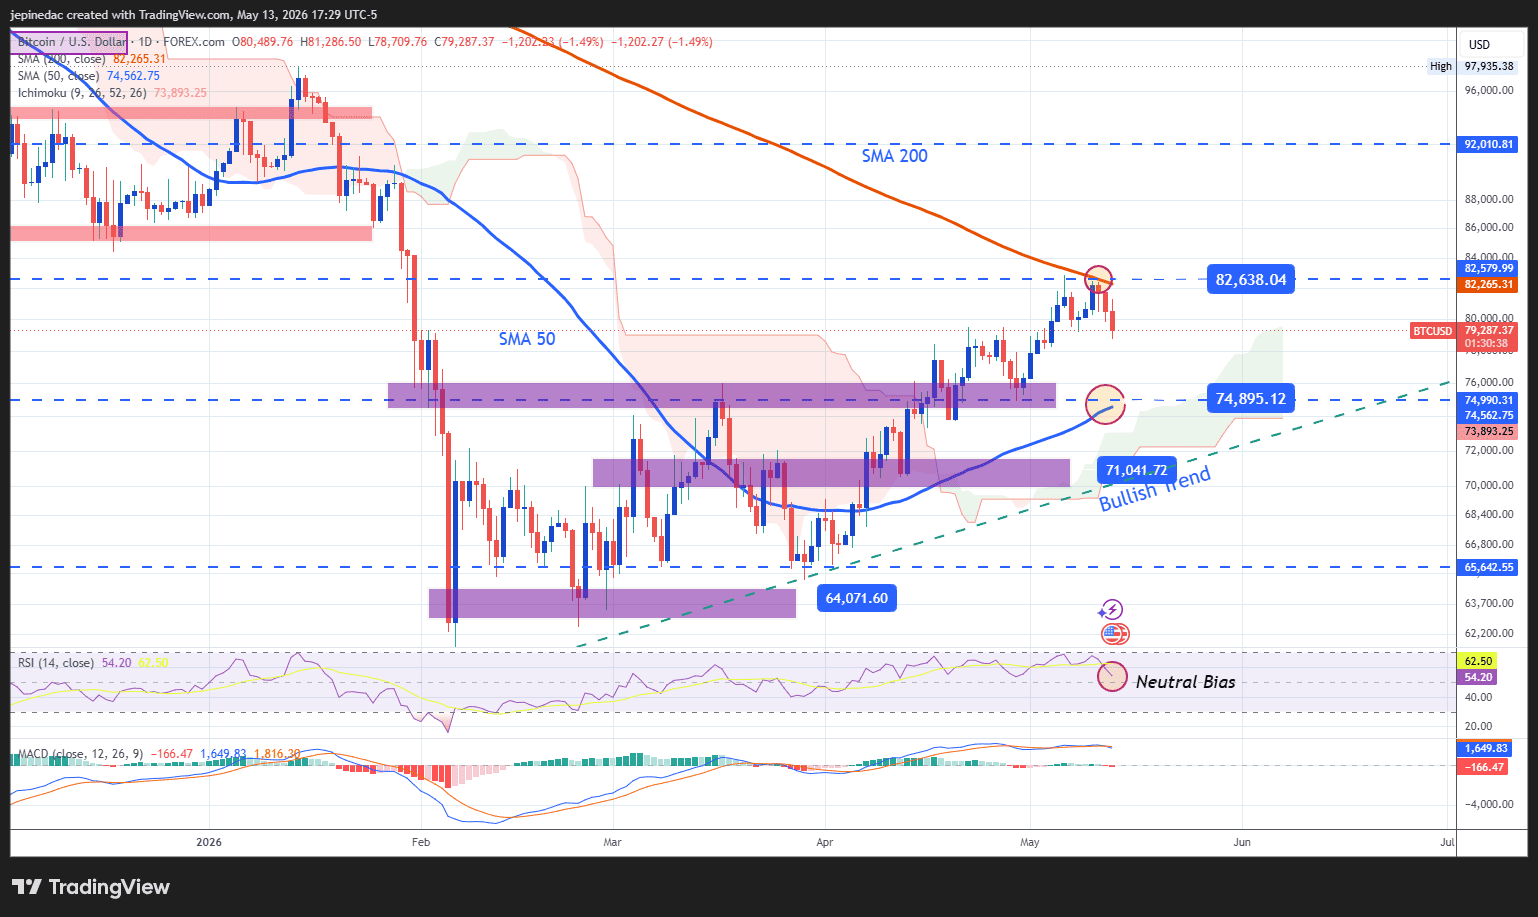
- Potential bullish trendline attempts to hold: Since the first days of February this year, a consistent pattern of higher lows has started to form in Bitcoin price action. To some extent, this has given way to a potential more consistent bullish trendline in BTC’s short-term movements. Although price is currently showing relevant weakness, the bearish correction still does not appear strong enough to show a clear risk to this potential bullish trendline. For this reason, it is important to keep in mind that this could remain the dominant technical pattern during the coming trading sessions.
- MACD: At the moment, the MACD indicator maintains a histogram with movements close to the 0 level, suggesting that a consistent balance has started to form in the average strength of short-term moving averages. This behavior could be signaling a possible phase of indecision in recent price action.
- RSI: The RSI shows a similar scenario, as the indicator line remains close to the neutral 50 area. This reflects a balance in the average momentum of the last 14 trading sessions, which also starts to highlight a phase of indecision that is becoming increasingly relevant in the short term.
Key levels:
- 82,600 – Important resistance: A relevant high area that coincides with the 200-period moving average barrier. Moves toward this level could reinforce the dominance of the bullish bias and, if broken with strength, open the door to a clearer extension of the short-term uptrend.
- 75,000 – Near-term barrier: A recent reference level that has acted as a retracement area in the last few sessions. This point could act as key support against possible selling corrections that may continue to appear in the coming sessions.
- 71,000 – Definitive support: An area located below the 50-period moving average, which currently stands as the most relevant downside barrier. Moves toward this level could reactivate selling pressure and call into question the recent structural shift, bringing a bearish bias back into focus in the market.
Written by Julian Pineda, CFA, CMT – Market Analyst
Follow him on: @julianpineda25