
Over the last four trading sessions, the USD/CAD pair has recorded a cumulative decline of approximately 0.8%, reflecting a gradual retreat of the U.S. dollar against a firmer Canadian dollar. This movement has been driven by shifting market expectations surrounding the Federal Reserve’s monetary policy, which has weakened demand for the greenback. Meanwhile, the Canadian dollar has benefited from a neutral stance by the Bank of Canada and from contained inflation, reinforcing its local stability. If these dynamics persist, USD/CAD may continue to trade under pressure in the short term.

Central Bank Dynamics
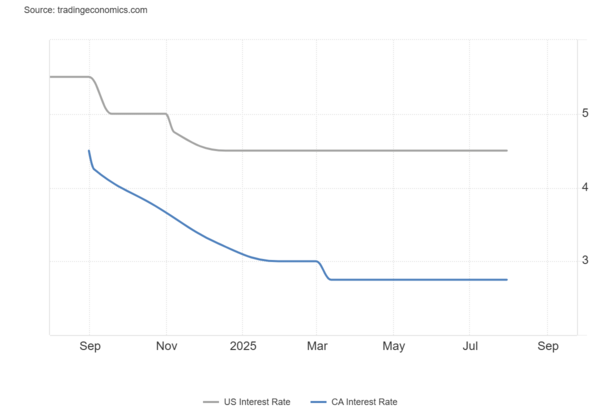
Currently, the Federal Reserve and the Bank of Canada maintain their benchmark interest rates at 4.5% and 2.75%, respectively. However, their outlooks are becoming increasingly divergent. The Bank of Canada has adopted a tone of stability after inflation returned to its 2% target range, giving it room to keep policy unchanged for now.
In contrast, the Federal Reserve faces a more challenging environment. The U.S. economy has begun to show mild signs of a slowdown, particularly in the labor market, where recent employment data has fallen short of expectations. This weakness has raised the likelihood that the Fed may begin a rate-cutting cycle sooner than previously expected, a view that is already priced into the markets.
Source: TradingEconomics
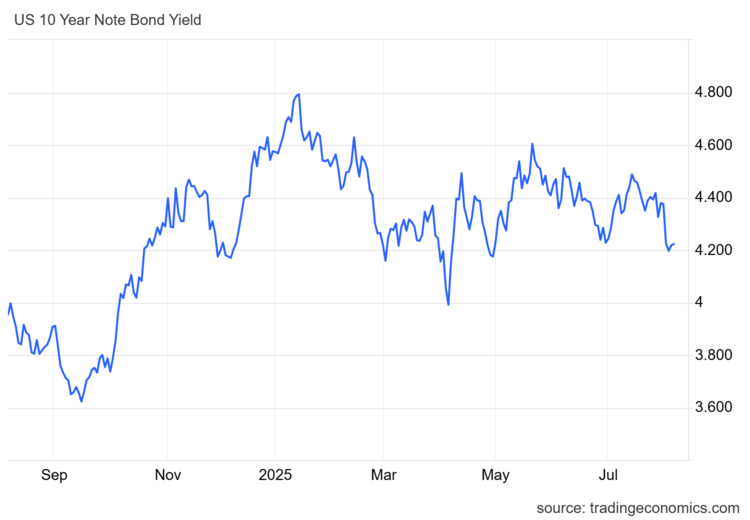
These expectations have placed pressure on U.S. Treasury bonds, which have seen their yields fall. The 10-year yield has declined to 4.2%, a level not seen in several weeks. This drop reflects reduced demand for dollar-denominated instruments and suggests that the market is beginning to anticipate a lower-rate environment, diminishing the dollar’s appeal.
Source: TradingEconomics
This scenario favors the Canadian dollar, which could remain strong if the Bank of Canada opts not to follow the Fed into rate cuts. A monetary policy divergence between the two could become a key driver of continued bearish pressure on USD/CAD in the near term.
What’s Happening with the U.S. Dollar?
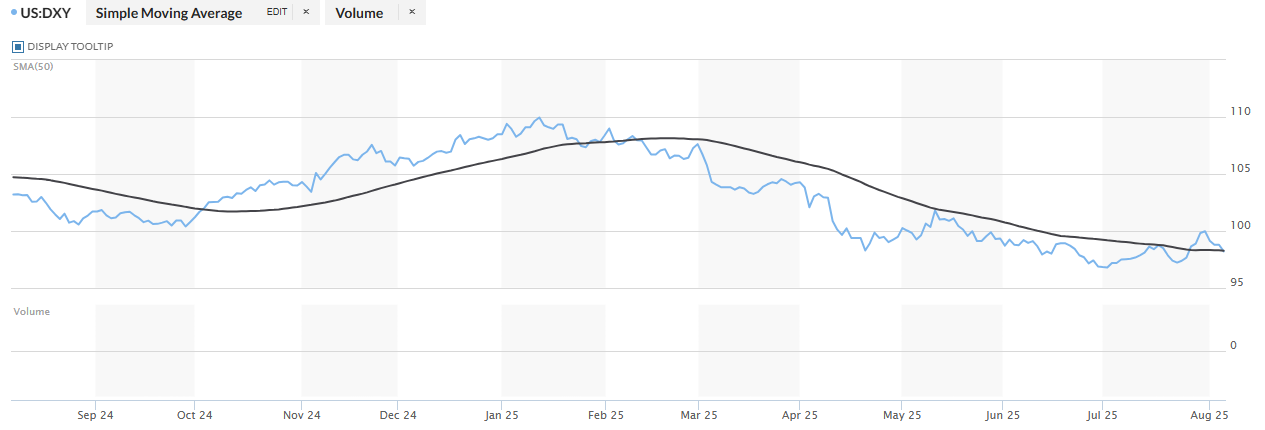
The downward pressure on the greenback is also evident in the recent behavior of the DXY index, which has dropped below the key 100-point level and has started to show a clearly bearish pattern. This decline underscores the market’s loss of confidence in the U.S. dollar in the short term.
Source: MarketWatch
If this trend of dollar weakness persists, other currencies, including the Canadian dollar, could benefit from capital flows shifting away from the U.S. Furthermore, if the DXY falls below the 98-point zone, the technical outlook for USD/CAD could deteriorate further, increasing the risk of an extended bearish correction.
USD/CAD Technical Outlook
Source: StoneX, Tradingview
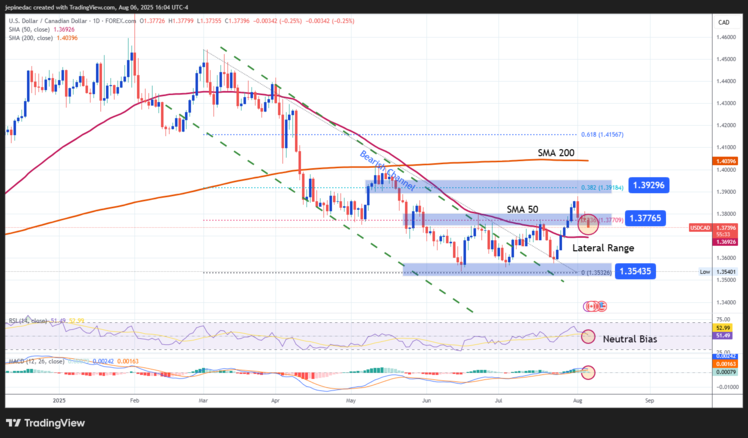
- Short-Term Lateral Channel: From a technical standpoint, the pair continues to trade within a well-defined lateral channel, with support near 1.35435 and resistance at 1.37765. This structure has held for several weeks, and although the pair has attempted to challenge the upper boundary, price action has not been strong enough to confirm a breakout. As of now, neutral momentum dominates, reinforcing the market’s consolidation within this range.
- RSI: The RSI line remains close to the 50 level, signaling technical balance and a lack of dominant momentum. This supports the continued sideways price action in the pair.
- MACD: The MACD histogram shows minimal fluctuations around the zero line, indicating a lack of directional conviction in moving averages. In this context, unless a clear signal emerges, USD/CAD may continue oscillating without a defined trend.
Key Levels:
- 1.35435 – Key Support: This level has served as a strong technical floor in recent weeks. A decisive break below it could mark the beginning of a new bearish phase.
- 1.37765 – Nearby Resistance: A critical zone aligned with the 23.6% Fibonacci retracement, which has capped price action within the channel. A break above this level could signal a return to short-term bullish momentum.
- 1.39296 – Distant Resistance: This level corresponds to the 38.2% Fibonacci retracement and represents the most important medium-term resistance. A move above this area could open the door to a prolonged bullish trend.
Written by Julian Pineda, CFA – Market Analyst
Follow him on: @julianpineda25