
Key Events
- WTI rises to $66 and Brent to $70 amid rising Middle East tensions, keeping upside hedging and dip buying risks in focus.
- Crude’s price action remains headline-driven rather than structural, highlighting the importance of key technical levels in confirming either trend continuation or a breakout from the two-year downtrend.
- U.S. dollar sentiment strengthened on hawkish Fed election risks, capping crude’s rally above the $66 mark, as markets also turn their focus to this week’s NFP report amid the greenback’s critical technical state.
Market volatility swung sharply on Friday ahead of the close, driven by headlines surrounding Trump’s support for a hawkishly perceived Fed chair, Iran’s willingness to negotiate, and renewed U.S. threats regarding structural agreements with Iran. These developments fueled a spike in cross-asset volatility:
- DXY rose over 1% from fragile year-to-date lows, reclaiming the 97 level
- WTI pushed above $66, Brent above $70
- Gold dropped nearly 1,000 points from its all-time high near 5,600 before reversing sharply on dip-buying toward the 4,800 level
- U.S. equity indices declined, with the Nasdaq falling over 1% on earnings concerns, AI-related volatility, and deteriorating sentiment
- Bitcoin fell below the $80,000 level
This volatility spike rippled investor caution across all market sectors, as headlines shifted rapidly through January. Markets now appear vulnerable to mean reversion risks into February and March, before the broader structural outlook becomes clearer.
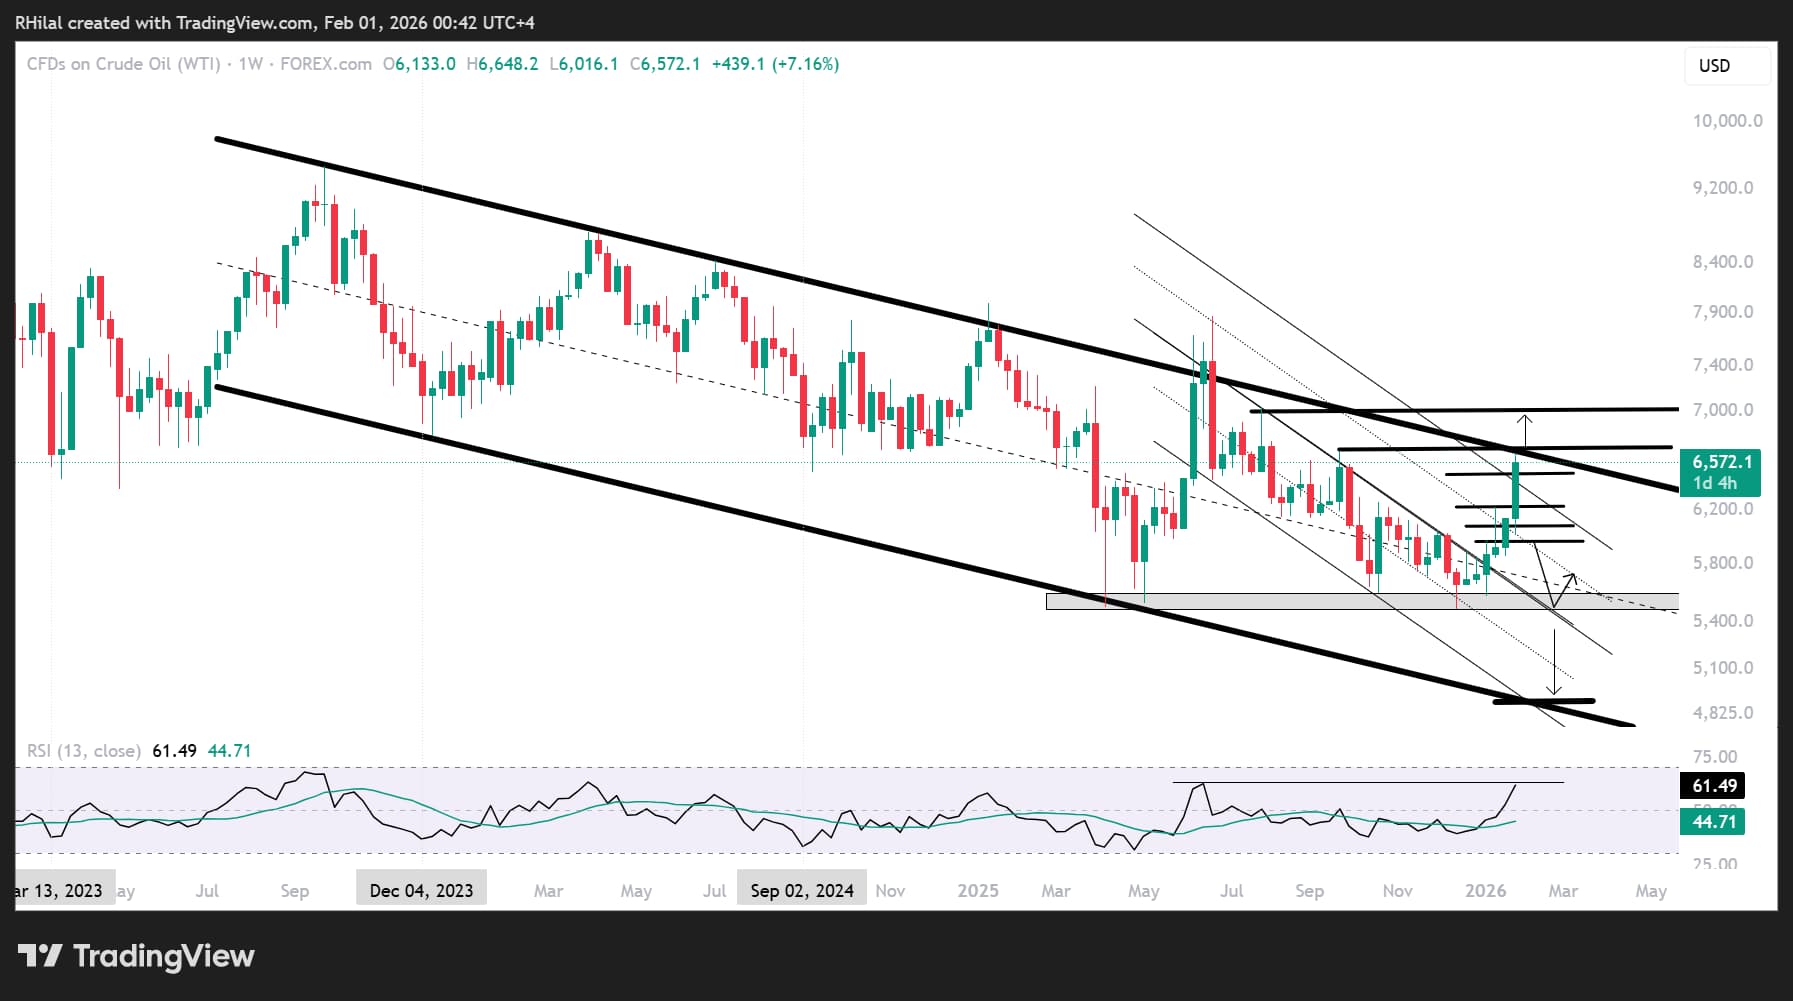
Crude Oil Outlook: Weekly Time Frame – Log Scale
Source: Trading view
From a trend perspective, the broader two-year outlook for crude remains downward, with recent rallies largely reflecting a repeating short-term uptrend aligned with the upper boundary of a well-defined descending channel in place since September 2023. WTI recently pulled back from this boundary near the $66.60 resistance, while Brent tests a breakout near the $70 psychological level.
Key Levels and Scenarios
- A sustained hold above $66.60, the September 2025 high and upper boundary of the descending channel, would open the door toward $70 initially, followed by $74. A clear break and hold above both the channel resistance and the $70 level (with similar confirmation needed in Brent) would be required to signal a longer-term bullish shift.
- RSI readings are approaching overbought levels, aligning with the June 2025 highs, which previously coincided with Middle East escalation hedging.
- On the downside, failure to hold current levels would bring $64, $61.80, $60.80, and $58.50 into focus.
- A deeper pullback could re-expose the $55 level, either as another dip-buying opportunity or as a gateway toward the lower channel boundary near $49.
Written by Razan Hilal, CMT
Follow on X: @Rh_waves