
The Democratic win triggered a steep sell-off across crude oil charts, pushing WTI toward the neckline of a potential major double-top pattern. However, the new Congress does not take office until January, while persistent geopolitical risks—including the latest Houthi escalations against Saudi Arabia—continue to keep a risk premium embedded in oil prices.
Hopes for U.S.–Iran negotiations and the prospect of a Democratic-led Congress have contributed to the recent pullbacks:
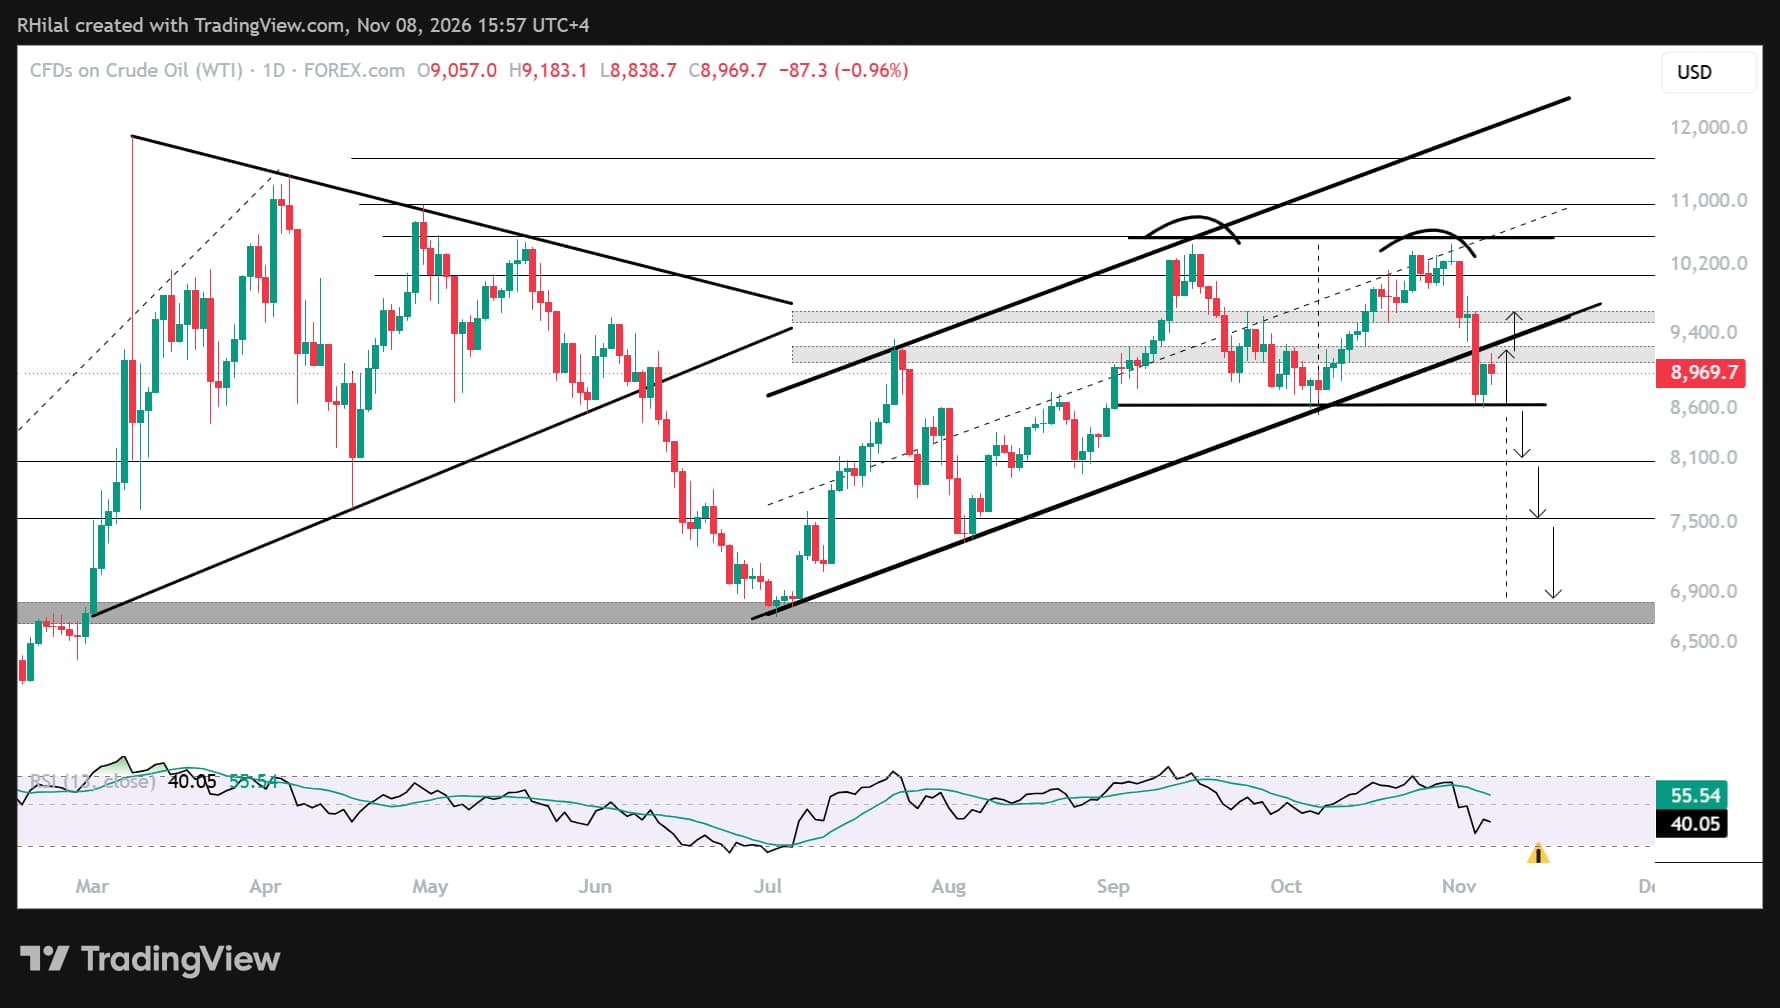
- WTI has fallen more than 17% from the 104.50–105 resistance zone toward support near 86. This level is a major support area, aligns with daily oversold conditions last seen in June and may form the neckline of a two-month double-top pattern.
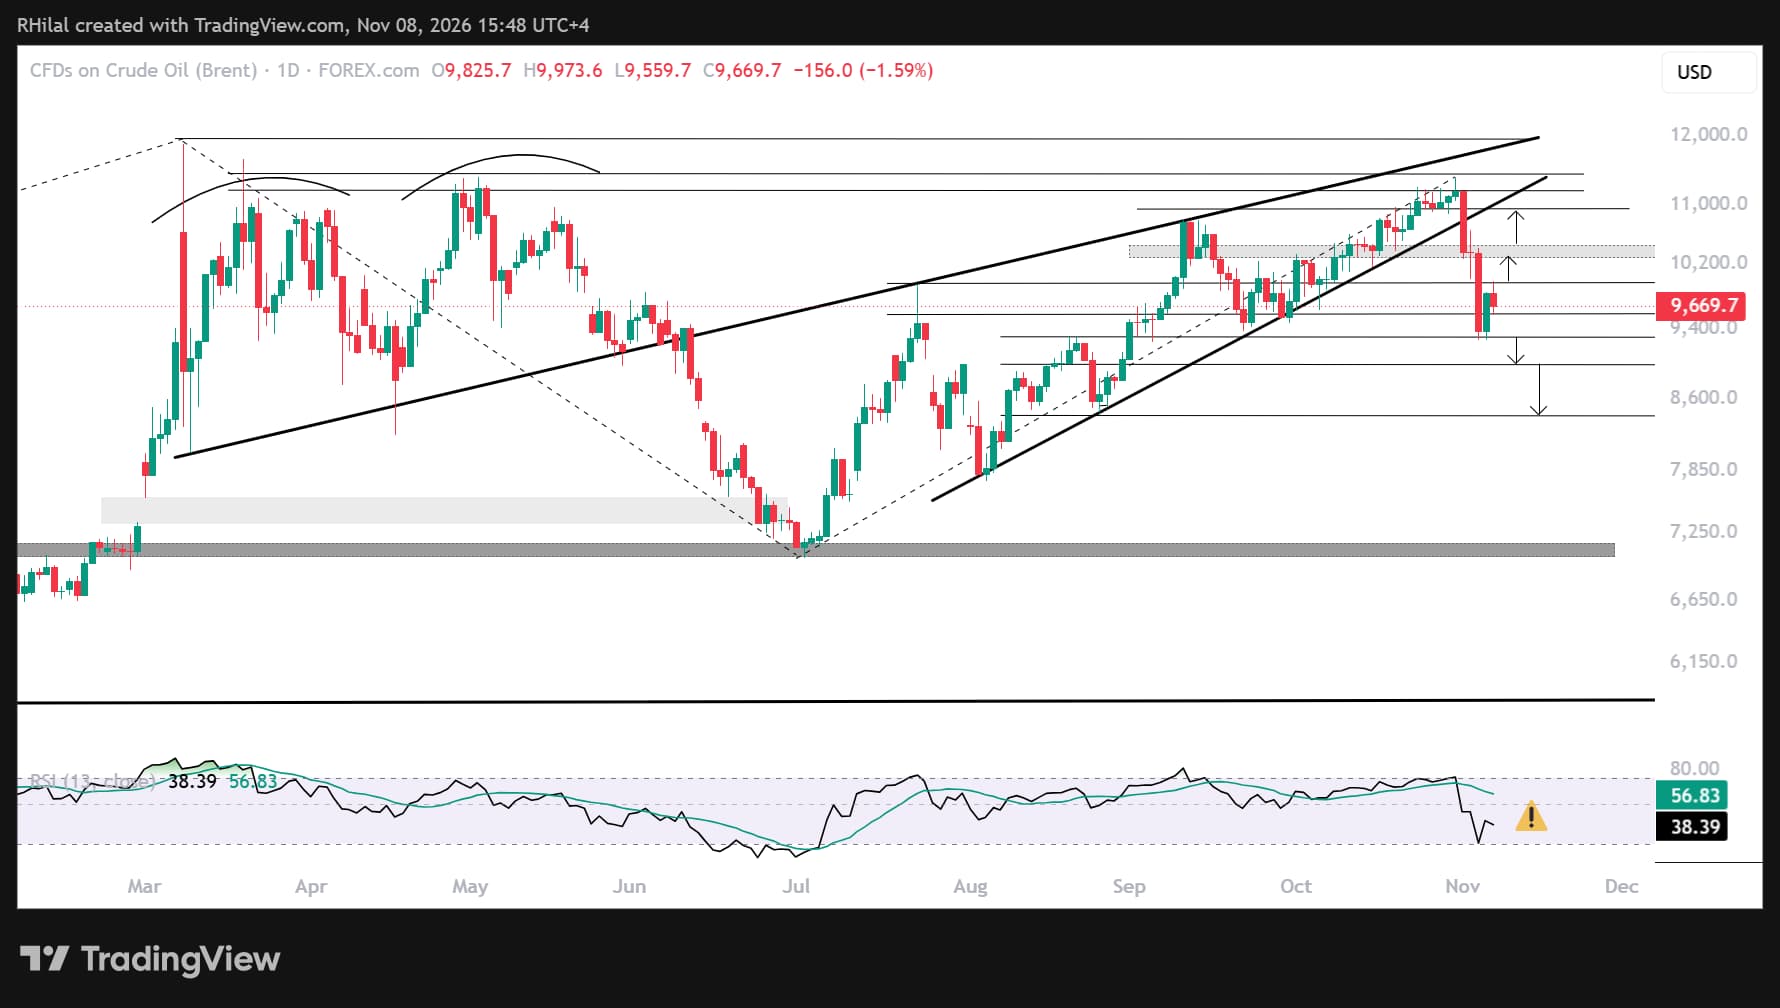
- Brent has fallen more than 18% from resistance near 114 toward support at 92.50. This level is a major support area, aligns with daily oversold conditions last seen in June and has held for four months.
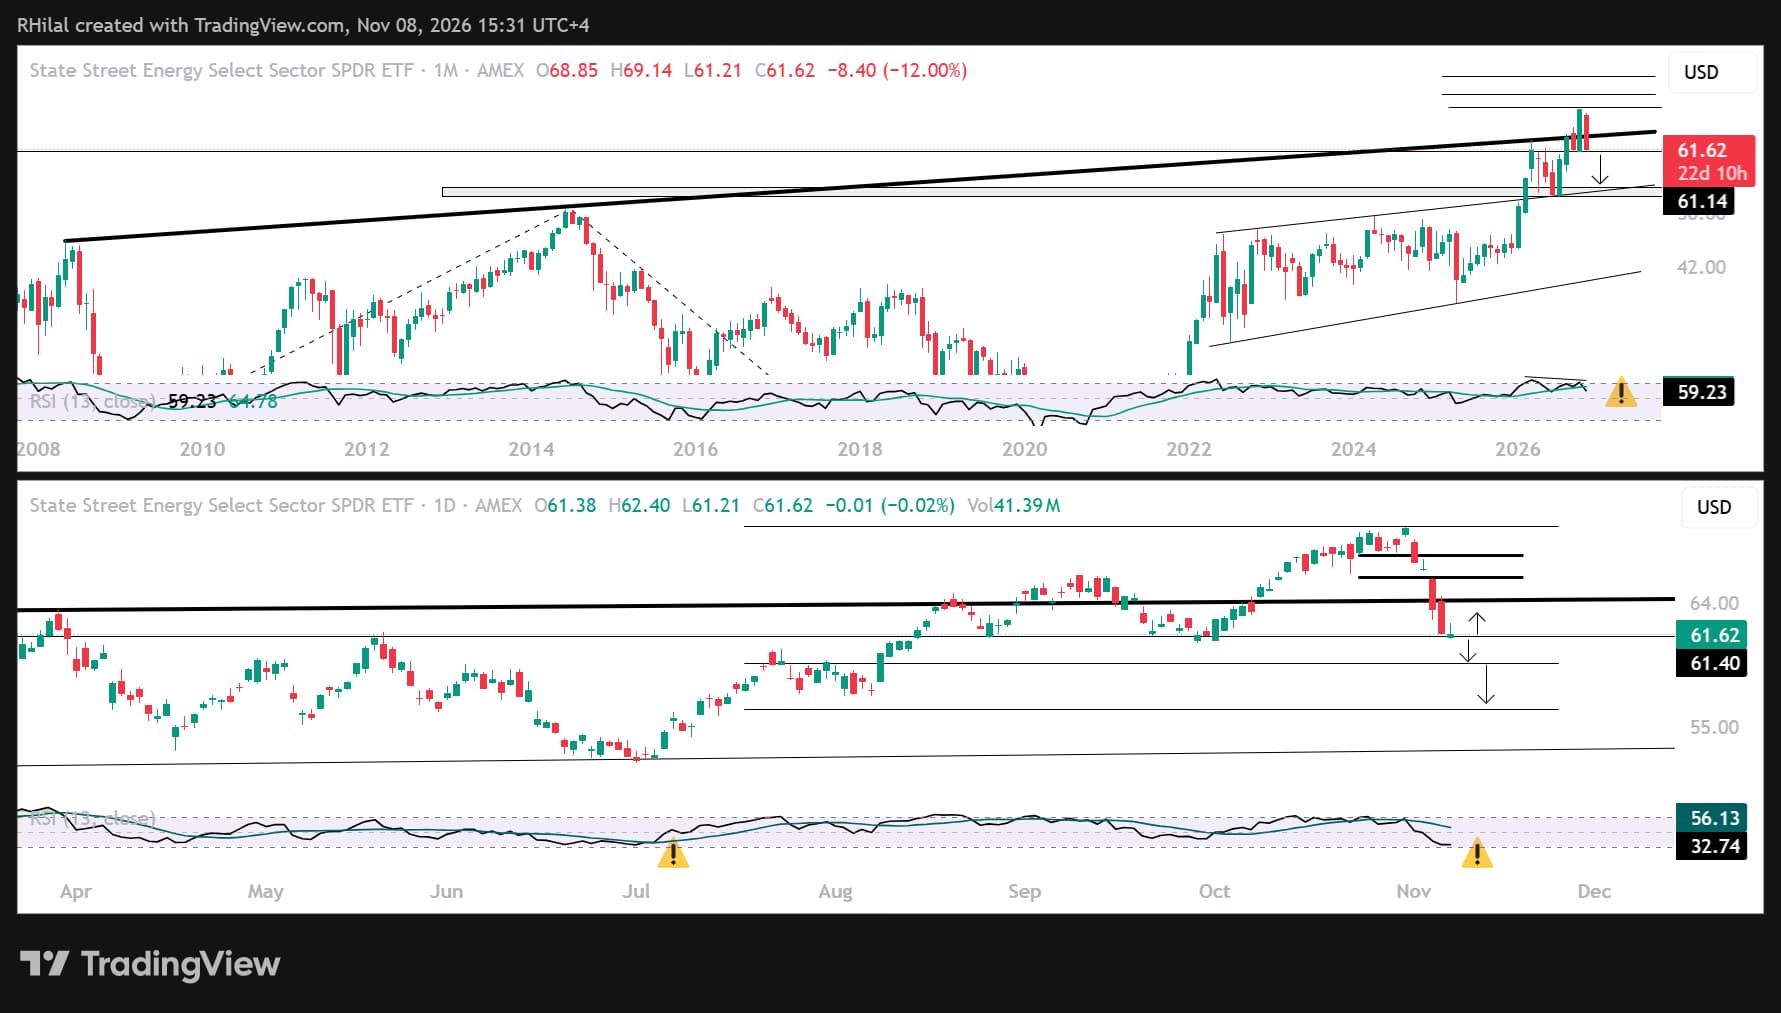
- XLE has pulled back more than 12%, falling below its long-respected 18-year resistance barrier and testing support near 61, alongside daily oversold conditions last seen in June.
This framework highlights the breakdown of long-standing bullish structures across crude oil and energy charts, while short-term rebound risks remain in focus amid persistent geopolitical risk premiums. Confirmation of a potential U.S.–Iran deal could trigger another wave of selling after any short-term profit-taking and uncertainty. Renewed escalation and a recovery above key resistance levels, however, could extend a bullish consolidation or revive a bullish setup, with implications for market risk appetite and central bank policy expectations.
WTI Crude Oil Weekly Outlook: Daily Time Frame – Log Scale
Source: TradingView
On the daily chart, WTI has twice rejected resistance near 104.50 since September, creating the potential for a double top. The pattern’s neckline may be forming near 86, which has acted as a key support level for the range over the past two months.
The daily RSI is testing oversold conditions last seen in June and July, highlighting near-term rebound risks. Meanwhile, the weekly RSI is testing the neutral 50 level, suggesting further downside potential if that barrier gives way alongside another bearish catalyst.
Key scenarios:
A breakdown below 86 would align with the 38.2% Fibonacci extension of the March–July–October wave. If this is a corrective pattern under the Elliott Wave framework, price could decline toward 81, 75.80 and 68, near the 50%, 61.8% and 78.6% extensions. These levels point toward the July 2026 low and pre-war levels, as well as the target implied by the potential double-top pattern.
On the upside, a move back above the July–November rising trendline connecting higher lows, followed by resistance at 92.50–97, could revive bullish risks. The next levels in focus would be the psychological 100 threshold and resistance at 104.50, where price could face another pullback or attempt a longer-term bullish continuation.
Brent Crude Oil Weekly Outlook: Daily Time Frame – Log Scale
Source: TradingView
Brent’s technical outlook shifted notably after price action narrowed near the 2026 highs and resistance at 114, then broke below the July–November uptrend. The steep sell-off of more than 18% found support near 92.50.
The broader Elliott Wave analysis points to a corrective pattern that began at the March 2026 high. The Fibonacci extensions of the March–July–October wave align with support near 92.50, a level that acted as resistance between August and September 2026 before turning into support.
A breakdown below this area would expose the 50% and 61.8% Fibonacci extensions near the psychological 90 level and support at 84.
On the upside, a move back above the psychological 100 level would be the first sign of a potential bullish shift. Following the rebound from oversold conditions last seen in June, price could target 104.50, 109 and 114. These levels would bring the 2026 highs back into view for another pullback test or a possible confirmation of longer-term bullish continuation. They also align with Fibonacci extension ratios for the wave spanning the July low, October high and November low.
XLE Weekly Outlook: Monthly and Daily Time Frames – Log Scale
Source: TradingView
The top chart shows XLE on the monthly time frame. Price has pulled back below a long-respected resistance level dating back 18 years to 2008, raising the possibility of a shift back toward a bearish bias after several attempts to break higher.
This shift echoes the developments in Brent and WTI following their bearish breaks below their respective July–November uptrends.
The bottom chart zooms in on the daily time frame, where price is testing oversold conditions last seen in June and the 50% retracement of the June–October advance near 61.30. A breakdown below 61 would strengthen the case for bearish continuation toward the 61.8% and 78.6% retracements near 59.30 and 56.30, respectively.
However, with daily momentum at multi-month lows, a short-term rebound remains possible, particularly if geopolitical tensions involving the U.S., Iran, the Houthis and Saudi Arabia escalate. Resistance near 64, 66 and 68 will help distinguish between bearish continuation and a renewed bullish shift above the 28-year trendline.
Written by Razan Hilal, CMT
Follow on X: @Rh_waves