
Weekly Technical Trade Levels on USD Majors, Commodities & Stocks
- Technical trade setups we are tracking into the start of the week on the USD Majors, commodities, and equity indices.
- Next Weekly Strategy Webinar: Monday, July 6 at 8:30am ET
- Review the latest Video Updates or Stream Live on my YouTube playlist
In this webinar we take an in-depth look at the technical trade levels for the US Dollar (DXY), Euro (EUR/USD), British Pound (GBP/USD), Australian Dollar (AUD/USD), Canadian Dollar (USD/CAD), Japanese Yen (USD/JPY), Swiss Franc (USD/CHF), Gold (XAU/USD), Crude Oil (WTI), Bitcoin (BTC/USD), S&P 500 (SPX500), Nasdaq (NDX), and Dow Jones (DJI). These are the levels that matter on the technical charts into the weekly open. The assets are chaptered on the recording for your convenience.
US Dollar Index Price Chart – USD Daily
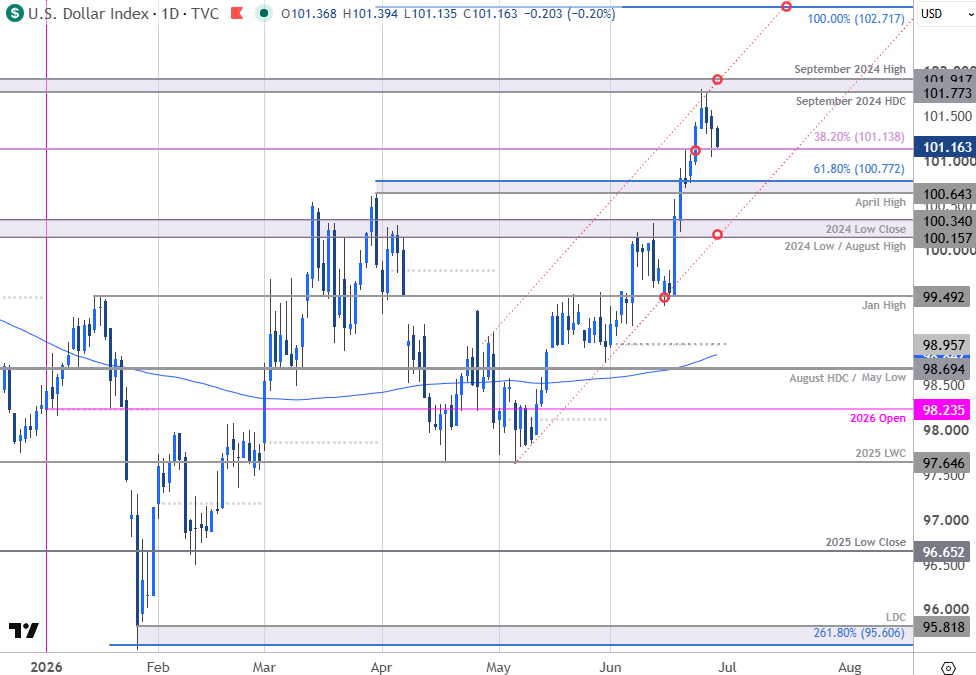
Chart Prepared by Michael Boutros, Sr. Technical Strategist; DXY on TradingView
Notes: The U.S. Dollar index responded to confluent resistance last week at the September 2024 high-day close (HDC) / high at 101.77/92. DXY has declined has extended more than 0.7% off the yearly high with daily momentum crossing back below the 70-threshold today. The bears are poised to mark a three-day decline with the index now testing support at the 38.2% retracement of the 2025 decline at 101.14.
A break below this level would expose subsequent support at the April high and the 61.8% extension of the January rally at 100.64/77 with broader bullish invalidation now raised to 100.16/34- a region defined by the 2024 low, the August high, and the 2024 low close. Note that channel support converges on this zone into the close of the week and a break / daily close below would be needed to suggest a more significant high is in place and a larger reversal is underway.
A topside breach above the monthly range high is needed to mark uptrend resumption with the next major technical consideration eyed at the 100% extension near 107.72. This level converges on the upper parallel mid-July.
Bottom line: The U.S. Dollar reversed off uptrend resistance with the pullback now testing initial lateral support. Risk for a deeper pullback if this gives way. From a trading standpoint, losses should be limited to 100.64 IF the index is heading higher on this stretch with a close above 101.92 needed to fuel the next major leg of the advance.
Keep in mind we are heading into a shortened holiday week and the end of the month / quarter with Non-Farm Payrolls on tap Thursday. Stay nimble into the monthly cross and watch the weekly close here for guidance.

British Pound Price Chart – GBP/USD 240min
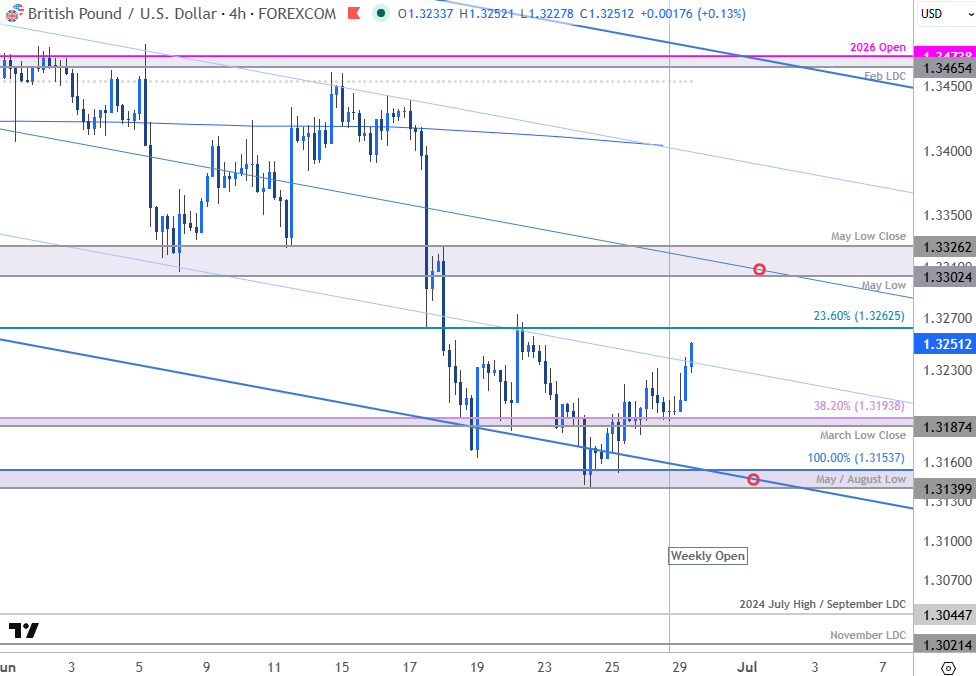
Chart Prepared by Michael Boutros, Sr. Technical Strategist; GBP/USD on TradingView
Notes: Sterling responded to confluent downtrend support last week at 1.3140/54- a region defined by the 2025 May / August lows and the 100% extension of the May decline. The subsequent recovery has extended more than 0.8% off the yearly low with initial resistance now in view near the 23.6% retracement of the April decline at 1.3263. Key resistance / near-term bearish invalidation is eyed at the May low / low-close at 1.3302/26. Note that the median line converges on this zone into the close of the week and a breach / daily close above would be needed to suggest a more significant low is in place and a larger reversal is underway.
Initial support rests with the March low-close and the 38.2% retracement of the 2025 advance at 1.3187/94 with key support steady at 1.3140/54. A break / daily close below this pivot zone would be needed to validate a breakout of the yearly opening-range and fuel the next major leg of he decline. Initial support objectives are eye at the 2024 July high and the September low-day close (LDC) at 1.3045 and the November low day close (LDC) at 1.3021.
Bottom line: GBP/USD has rebounded off downtrend support with the rebound threatening a larger recovery here with the broader structure. From a trading standpoint, rallies would need to be limited to 1.3326 IF price is heading lower on this stretch with a close below 1.3140 needed to fuel the next major leg of the decline.
Economic Calendar – Key Data Releases

Economic Calendar - latest economic developments and upcoming event risk.
--- Written by Michael Boutros, Senior Technical Strategist
Follow Michael on X @MBForex