
December rate cut bets stand near 90%
- Holding US Indices near key resistance levels before another record rally
- Pressuring the DXY to one-month lows below the 99-barrier
- Challenging major currency pairs against their 2025 gains
- Positioning precious metals for another bull cycle
However, the usual risks of a priced in market leading up to the FOMC meeting may be present, in line with Santa rally risks, increasing the weight on the near-term support and resistance levels.
The DXY chart remains one of the primary anchors in market analysis, offering signals that may later influence broader market direction.
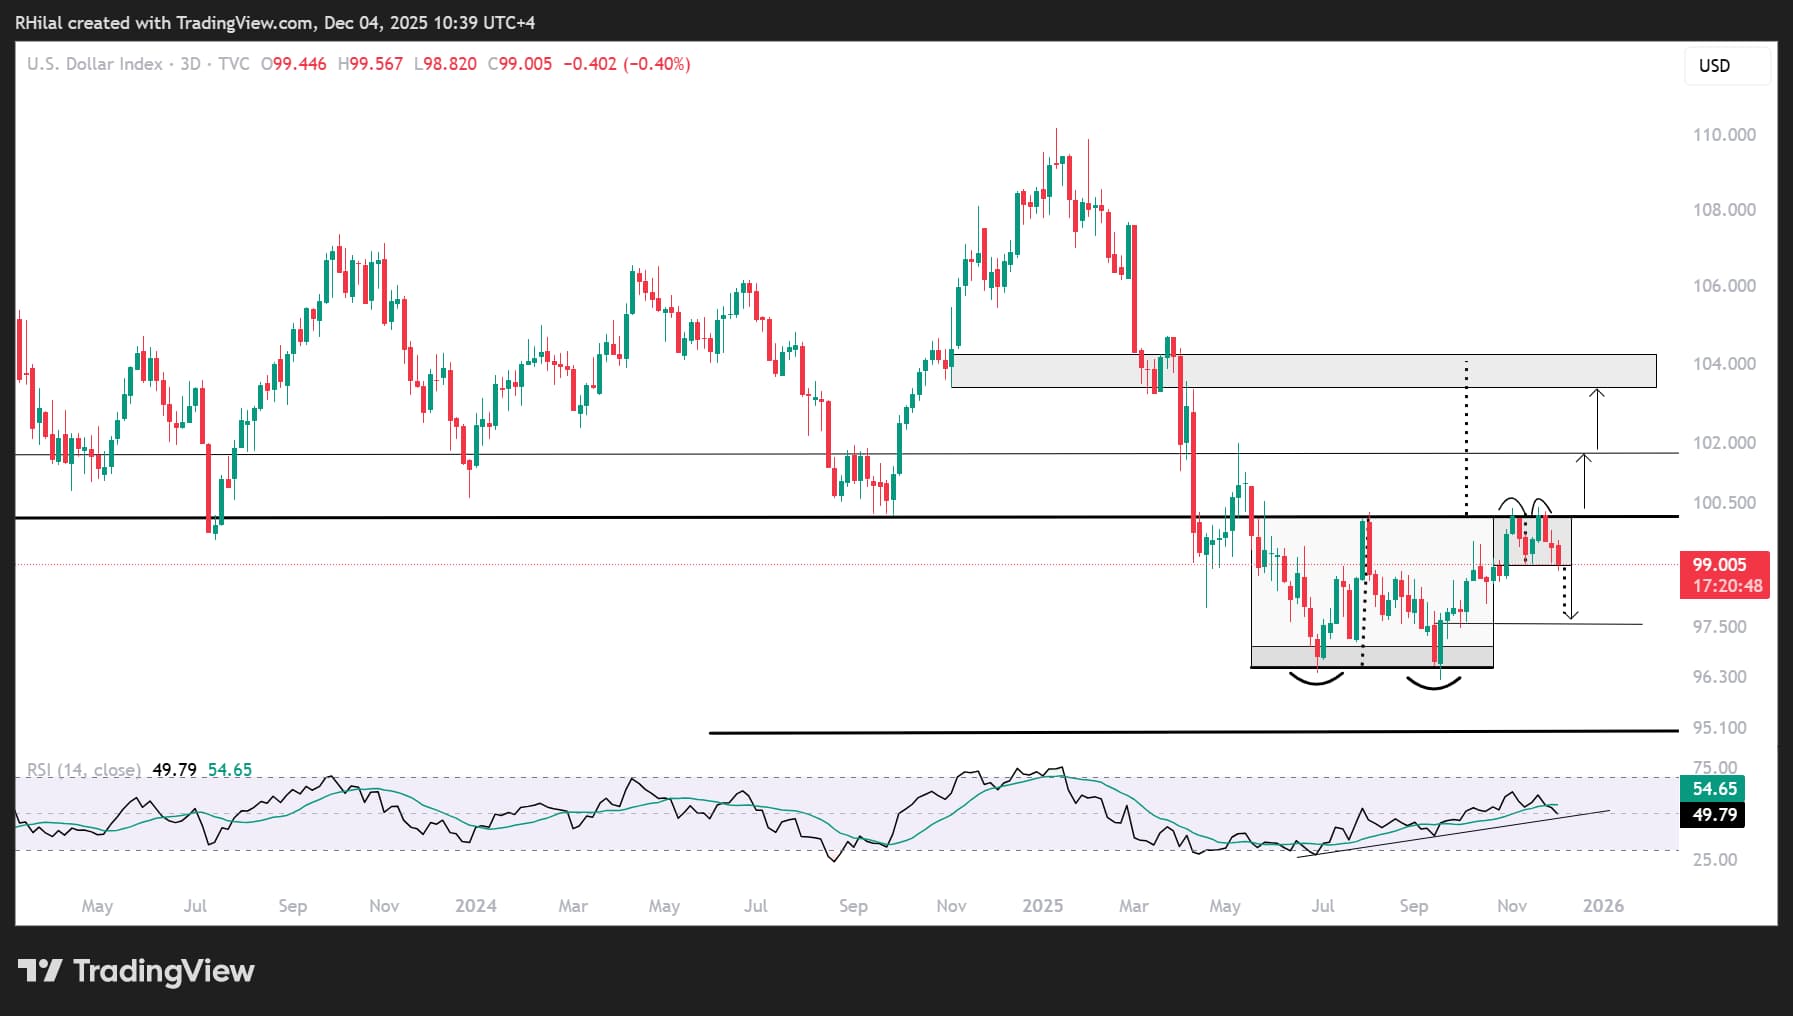
DXY Outlook: Daily Time Frame – Log Scale
 Source: Trading view
Two reversal patterns can be identified on the DXY, both awaiting further confirmation before extending their respective targets. These patterns sit just below a previous support zone (January 2023 to September 2024) that has now turned into key resistance near the 100.20 mark.
The first is a double-bottom formation near the 96 level between July and September 2025. Confirmation above 100.30 is needed to extend gains toward 101.70, 103.40, and 104.20. A move of this magnitude would erase gains across major currency pairs, including EUR/USD and GBP/USD, with key downside levels around 1.12 and 1.27 respectively.
The second is a short-term double-top pattern formed in November, also respecting the broader 100.20 resistance zone. A clear break below 98.80 is required to confirm a DXY pullback consistent with rate-cut expectations, targeting 98.00 and 97.50 supports. Such a move could help lift major currency pairs back toward their 2025 record highs.
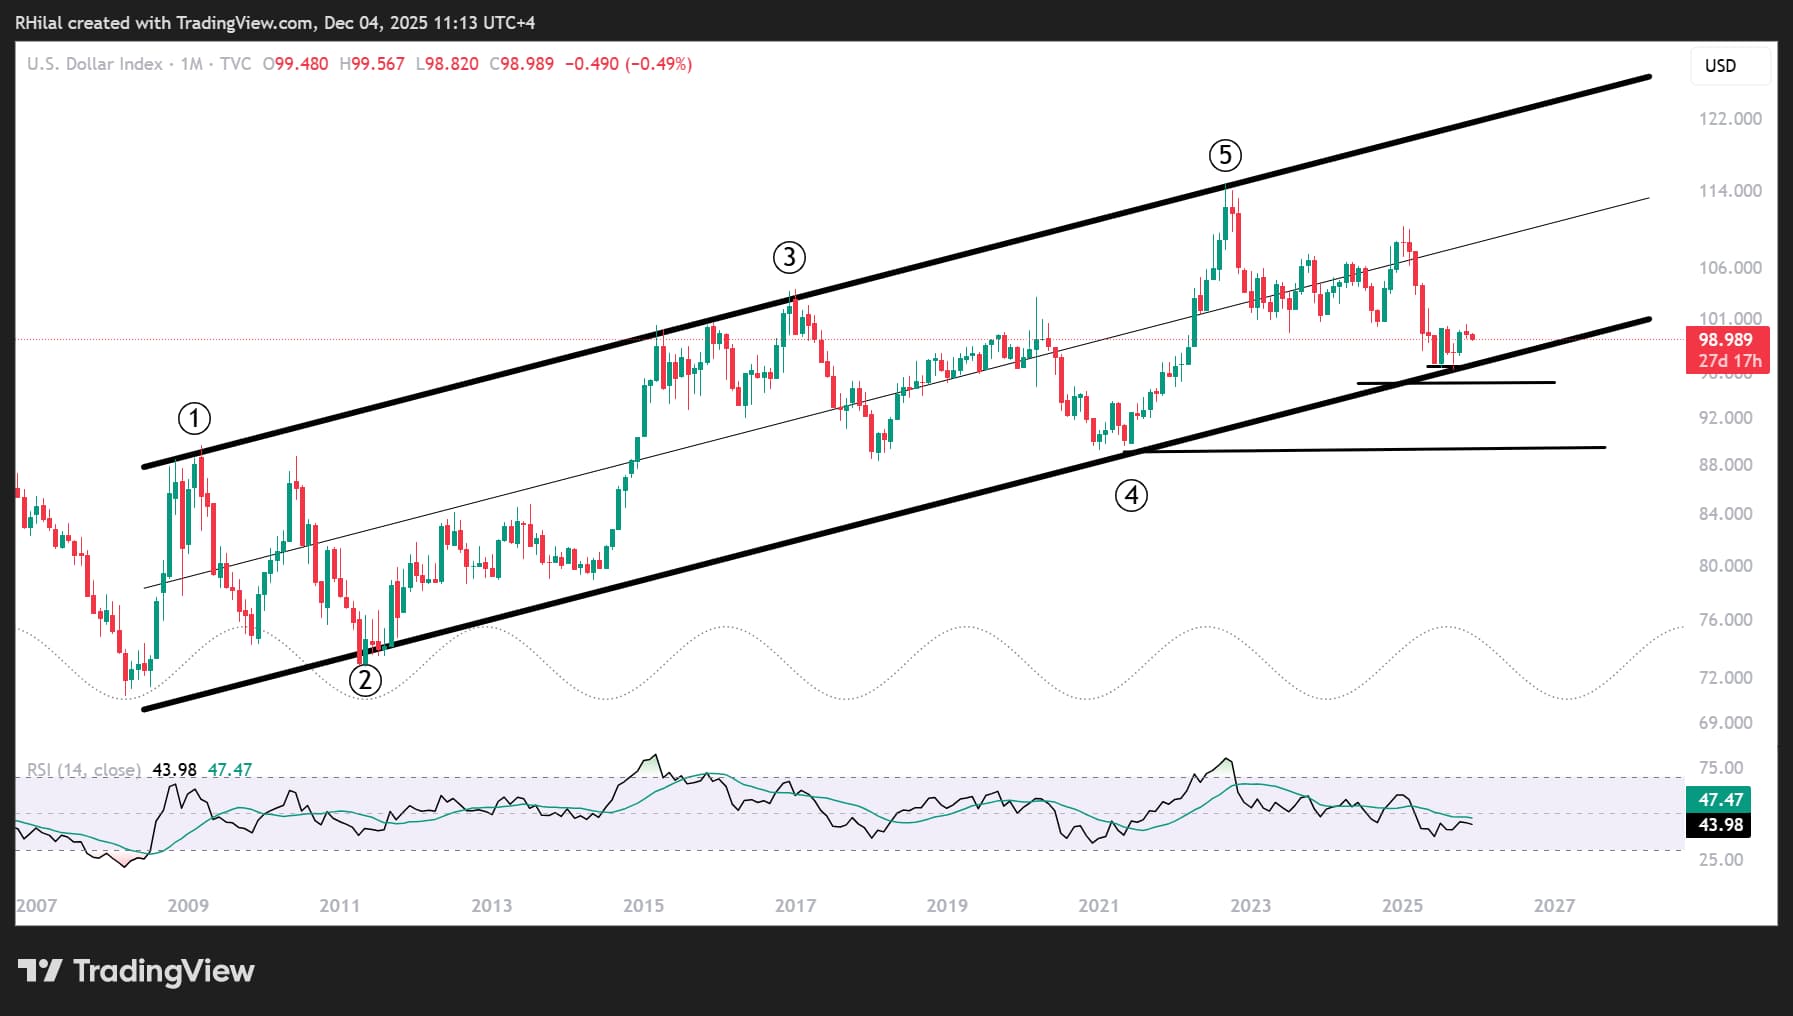
With overall price action remaining above the 17-year trendline established since 2008, the long-term bias remains bullish unless a clean break below the 95 low occurs.
DXY Outlook: Monthly Time Frame – Log Scale
Source: Trading view
As the saying goes, the trend is your friend. Unless the index decisively drops back below the 96-mark, the long-term bias remains bullish, supported by an up trending parallel channel that has held since the 2008 lows.
Year-end liquidity may be challenging ahead of the upcoming FOMC meeting, increasing the relevance of long-term timeframes, key price levels, and structural outlooks across the charts to confirm the next directional moves heading into 2026.
Written by Razan Hilal, CMT
Follow on X: @Rh_waves