Q2 has so far started with a strong bounce in risk markets as stocks and gold and silver have all continued to drive from rallies that showed up on the final day of last quarter.
Going along with the theme is the inverse relationship with the US Dollar, which posted a bearish engulf on the daily chart yesterday and has so far continued to fall today. Given the recent inverse correlation between the Dollar and oil prices, that makes sense, as hope has taken over that there may be a turning of the corner for the military operation in Iran. But, traders should be careful as what could’ve easily been driven by quarter-end flows may turn out to be a simple pullback in a broader bearish theme (for stocks, eur/usd, etc, but bullish for oil and the USD).
In yesterday’s webinar I looked at this from a few different vantage points and that extended the discussion around the Euro from last Friday, when I looked at longer-term support structure and the prospect of a higher-low. On Monday, the ‘s2’ level I had looked at on Friday came into play and, so far, that’s held the lows and driven a bounce. That level plots at 1.1451 and if bulls can hold it, it can be considered as a higher-low above the prior swing-low at 1.1411.
EUR/USD Four-Hour Chart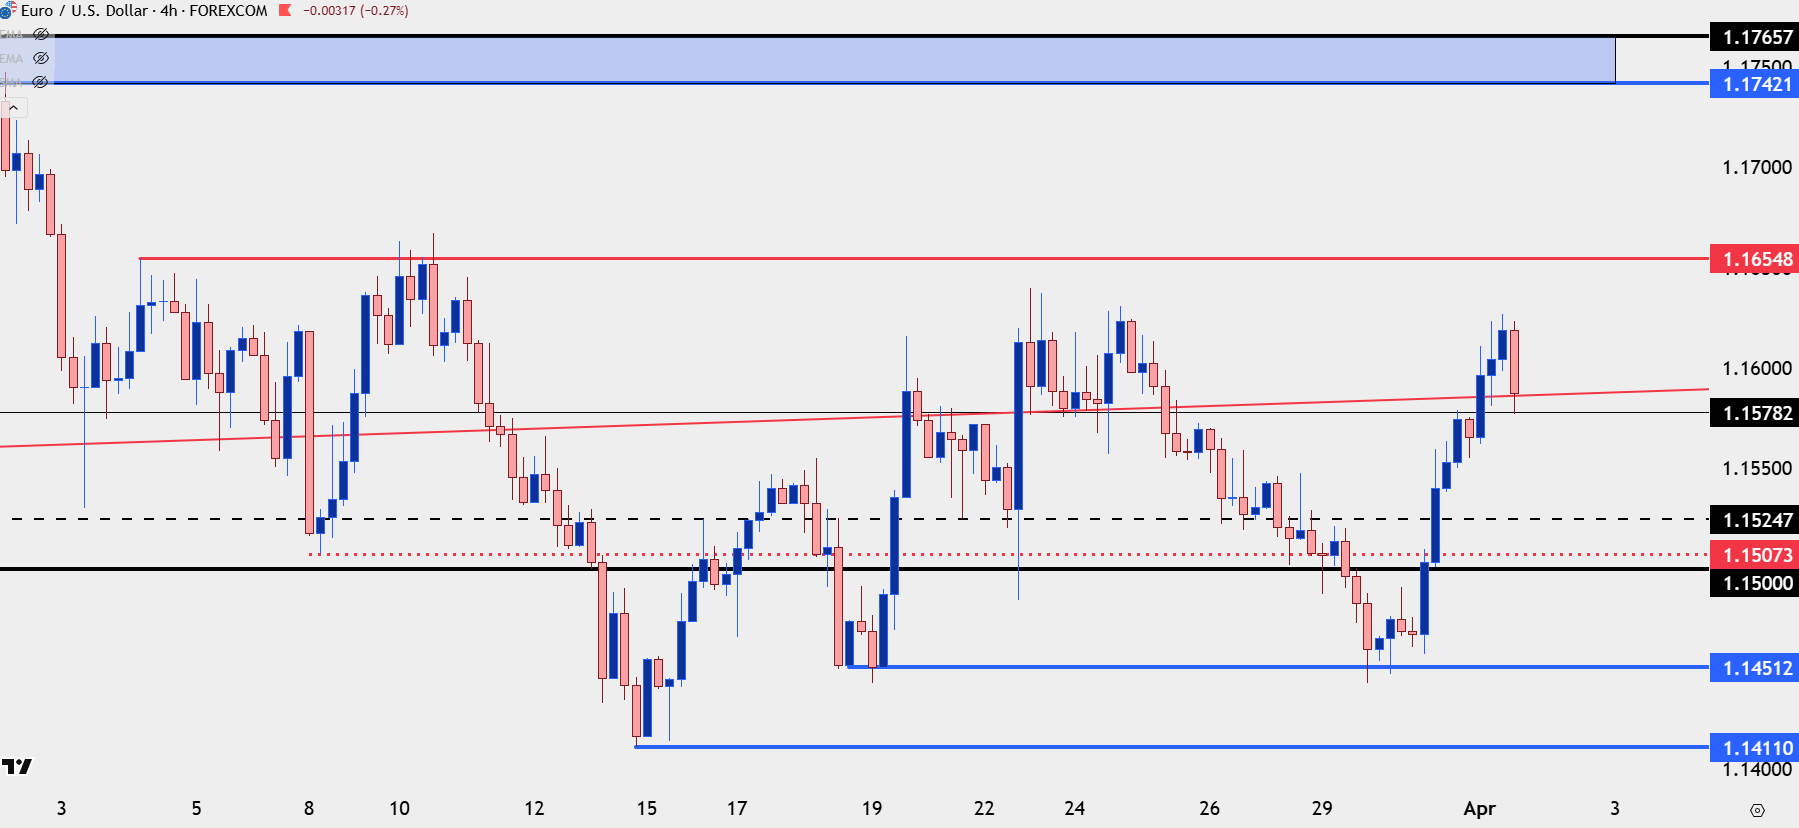
Chart prepared by James Stanley; data derived from Tradingview
EUR/USD Bigger Picture
The weekly chart provides some important perspective here as it’s the 1.1500 level that’s put up fight over the past week and a half, and as you can see this is a level that traditionally doesn’t give way easily. Bulls aren’t completely out of the wood yet, however, as sellers have continued to respond to sell rallies, keeping price from setting a higher-high and building a broader bullish trend on the daily chart, which I’ll look at below.
EUR/USD Weekly Chart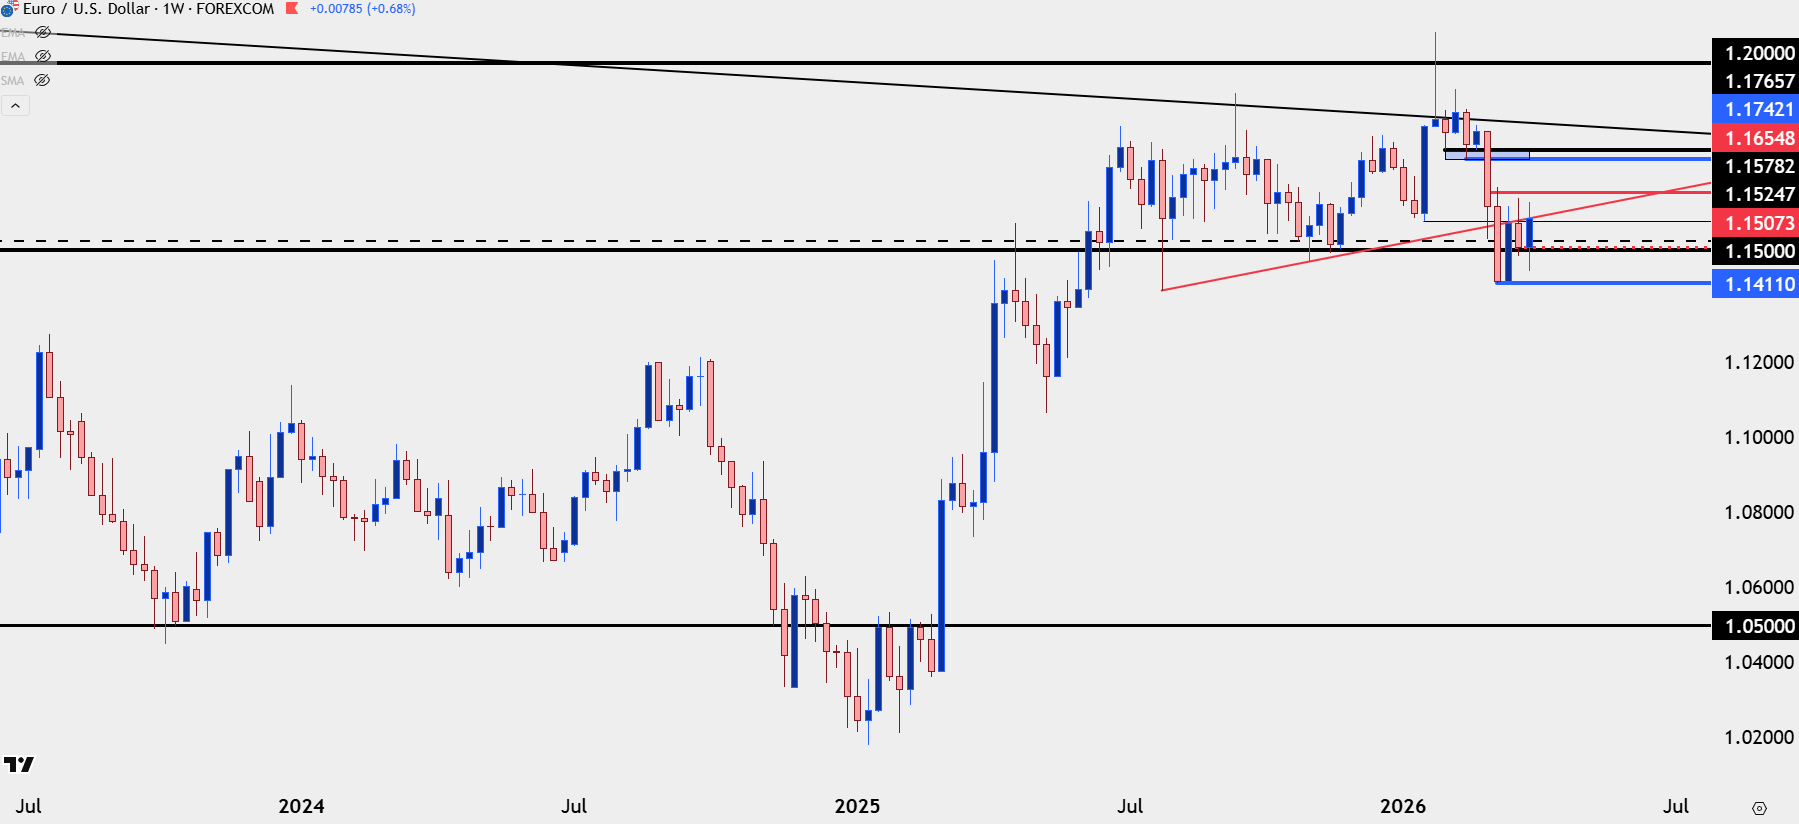
Chart prepared by James Stanley; data derived from Tradingview
EUR/USD Daily Chart
The daily chart below highlights bullish potential given the hold of higher-lows, yet we’re still in a space where EUR/USD bears have continued to react to resistance so it’s not quite an open door for topside swings. The 1.1655 level, however, sets an important line in the sand, and if breached, the door opens for a test of prior support at 1.1742-1.1766. At that point, the bullish backdrop will look a bit more convincing, with another door open for a run up to and test of the 1.1800 handle and, if successful, the prior lower-high at 1.1927.
EUR/USD Daily Chart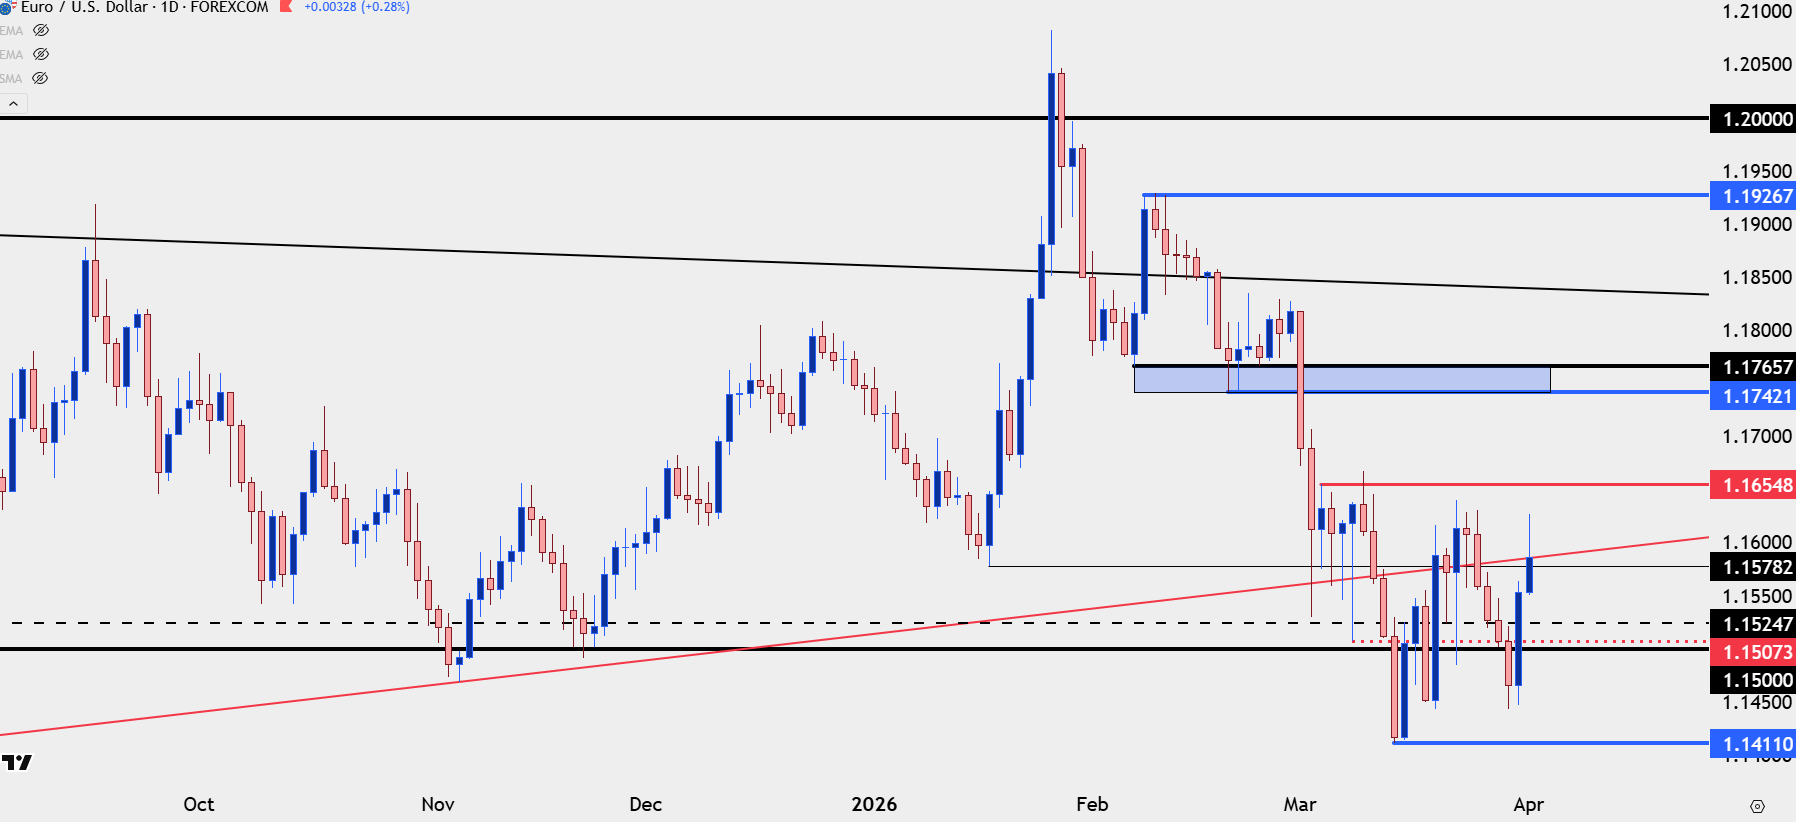
Chart prepared by James Stanley; data derived from Tradingview
--- written by James Stanley, Senior Market Analyst, Global Macro