


Euro, EUR/USD talking points:
- We heard from the ECB last week and the Fed this week, yet EUR/USD continues to work around the 200-day moving average without a noticeable trend yet taking hold.
- Bears did have an open door to push the pair after setting a fresh monthly low but a fast drop in U.S. yields as regional banking stress has re-appeared has pared back that move, and EUR/USD bulls are now testing another push above the 200-day moving average. And, notably, the falling wedge formation remains in order, which can keep the door open for bulls ahead of tomorrow’s Non-farm Payrolls (NFP) report.

It’s been a busy couple of weeks across global markets and tomorrow brings another big event with the release of January Non-farm Payrolls. After the FOMC rate decision yesterday, where Powell pointed out that the Fed wasn’t yet read to make any moves but would closely be watching data for indications of when or how much to push rates, the importance of tomorrow’s report might be a bit more so than was last month or the month before.
Expectations are for the U.S. labor market to have remained strong with a 3.8% unemployment rate. The headline expectation is for +180k jobs to have been added to U.S. payrolls in January and there’s also the expectation for Average Hourly Earnings to have come in at an annualized 4.1%. That speaks to wage inflation and that’s certainly a factor in the Fed’s decision making, as is the 3.8% unemployment rate which illustrates a strong labor market that’s inside of the Fed’s own natural rate of unemployment. Both of those items can be seen as a hindrance to the widely-expected rate cuts that have been priced-in to U.S. bond markets.
In EUR/USD, the tango continues as the pair has continued in a mean-reverting state even through a plethora of drivers. The pair continues to oscillate around the 200-day moving average without a discernible trend yet taking hold. This could change, however, especially given the daily price action shown so far this morning.
After the FOMC rate decision, USD strength appeared as DXY began to re-test its own 200-DMA. In EUR/USD, this amounted to a fresh monthly low, with price testing the bottom trendline of a falling wedge formation. The resistance side of that formation is confluent with the weekly high around 1.0886 and if bulls can begin to breach above that, there may finally be a break in the impasse that’s set in to a number of major FX markets in the first month of the year.
EUR/USD Daily Price Chart
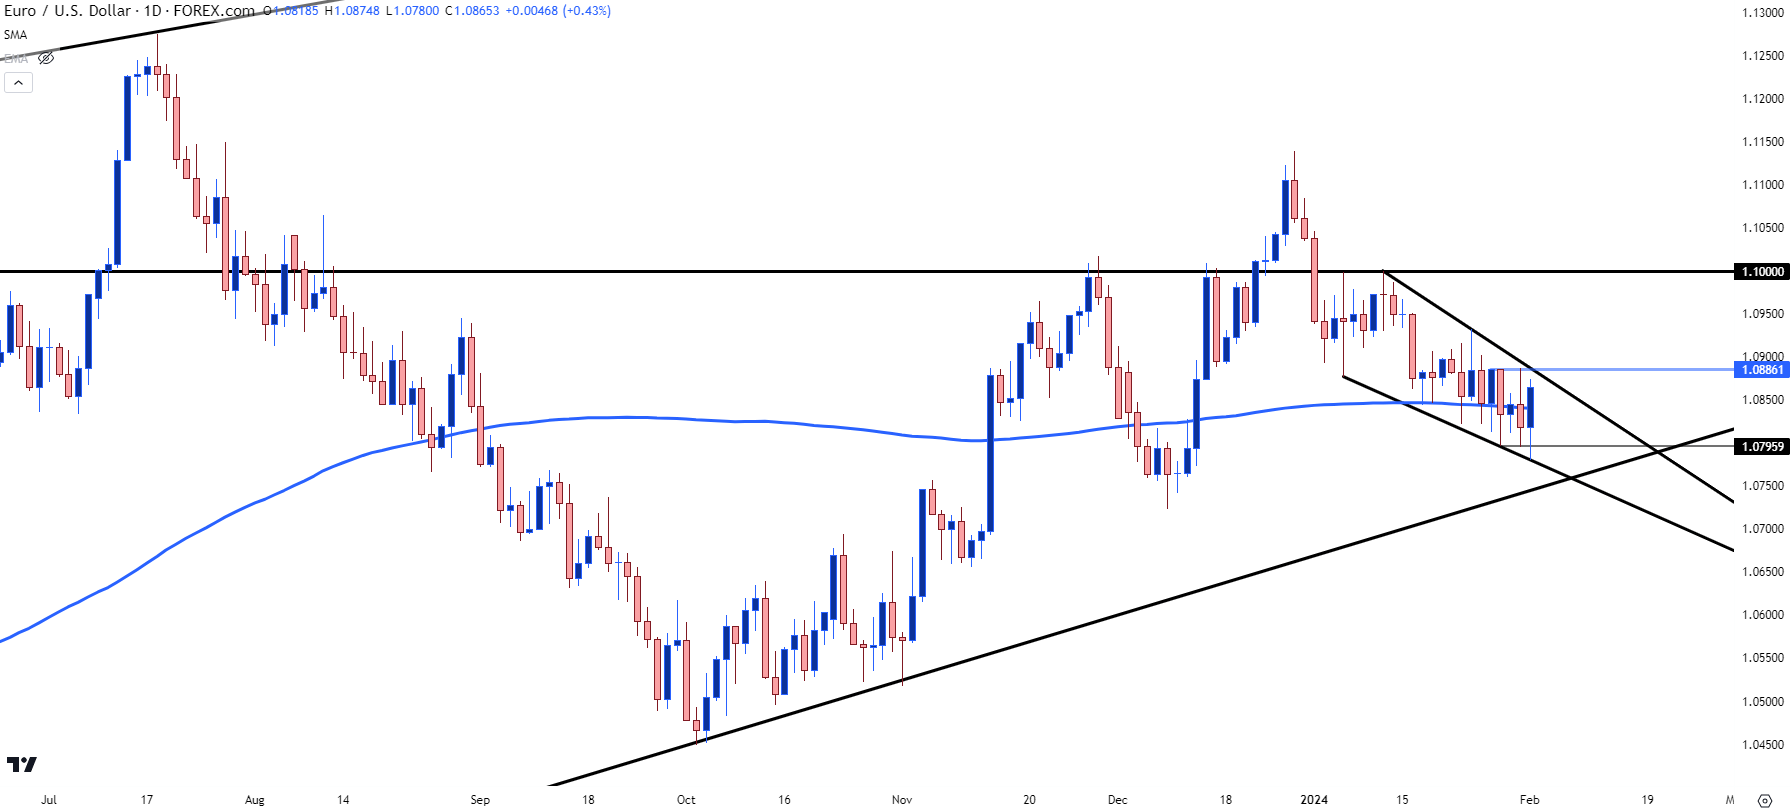 Chart prepared by James Stanley, EUR/USD on Tradingview
 EUR/USD Levels
The big level above current price is the 1.1000 handle, which has now held two almost perfect inflections so far in 2024 trade. That resistance hold led to the initial pullback to the 200-dma, and that test started two weeks ago. Since then it’s been a lot of barbed wire on the charts as price has retained a slightly-bearish bias. But sellers have been more aggressive at highs or near resistance than what’s shown so far at the lows or support, and that’s led to the build of a falling wedge formation.
Falling wedges are often approached with aim of bullish reversal and one of the reasons is the slowing of lower-lows, which can be aided by a support level such as the 200-day moving average. This, combined with the fact that selling pressure disappeared after the print of fresh lows yesterday following FOMC, keeps the door open for bullish continuation.
The 1.0886 resistance level is just above, and if bulls can break through there, the next resistance level appears at a spot of support-turned-resistance at 1.0930.
On the underside of price action, 1.0796 retains some appeal; but it’s the zone around 1.0750 that appears to have longer-term consequence. This was resistance in early-November, and then became support in December ahead of that FOMC rate decision. As of this writing, it’s also confluent with the longer-term bullish trendline taken from September 2022 and October 2023 swing lows.
If bears can force through that then the door can open more widely for short-side trends.
EUR/USD Four-Hour Price Chart
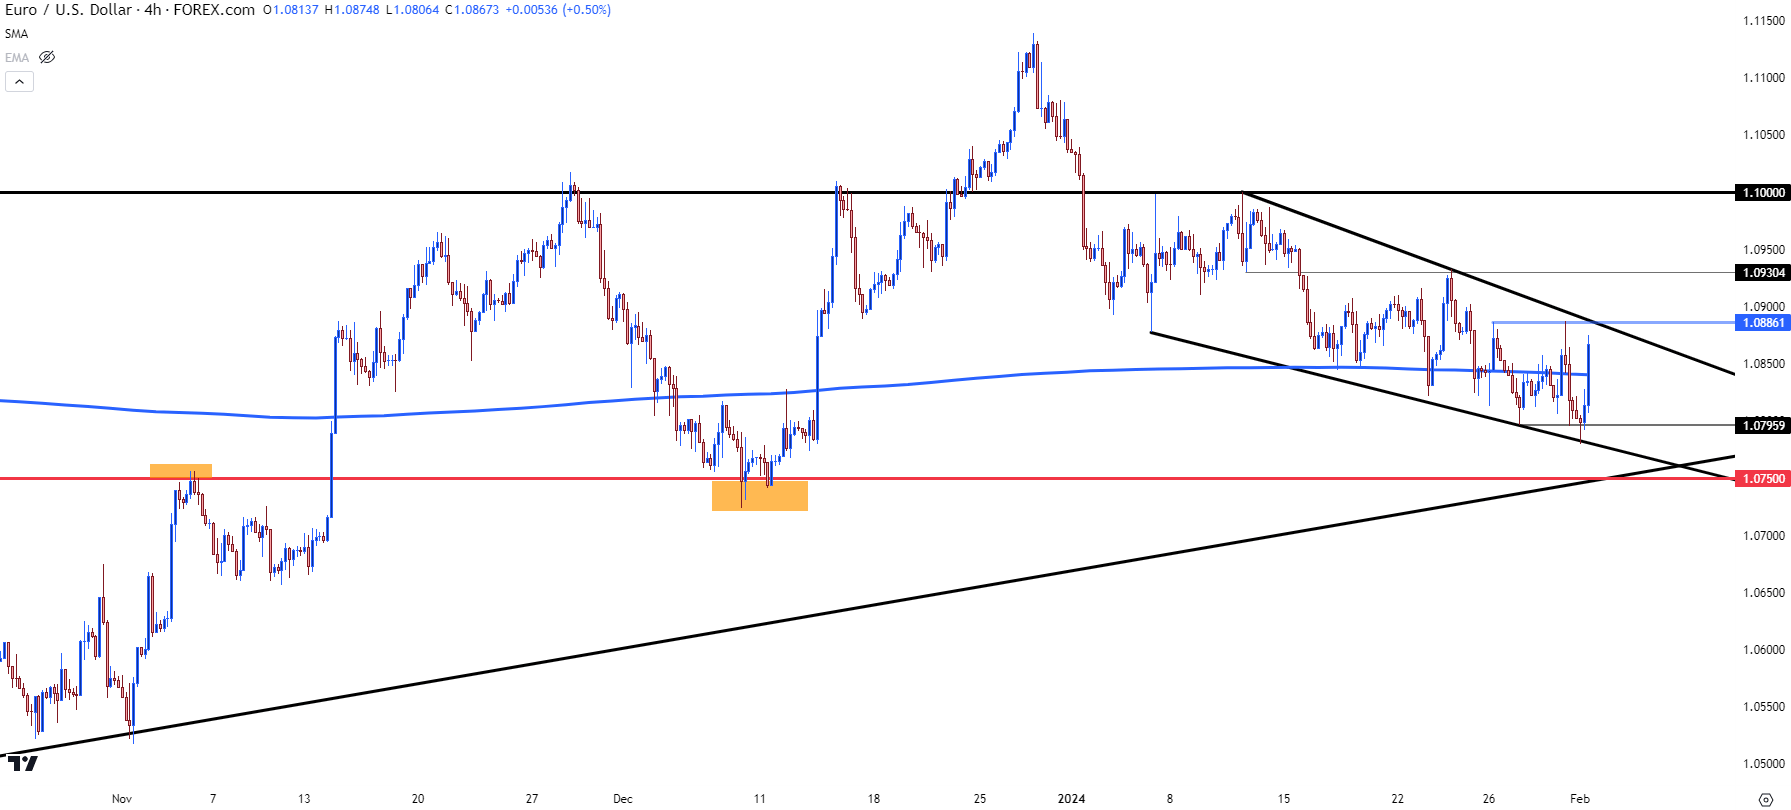 Chart prepared by James Stanley, EUR/USD on Tradingview
--- written by James Stanley, Senior Strategist






