
With traders slowly returning from holiday, ahead of a data-heavy second half of the week ahead, some volatility wouldn’t be a surprise — not just for gold, but for other dollar-denominated assets as well, particularly if the numbers throw up any shocks. Gold’s more recent rally owes a lot to the global shift towards lower interest rates. That makes incoming US data especially important for the gold forecast right now, all the more so as there are early signs that central bank buying may be starting to cool.
What to watch out for this year?
Gold has started 2026 on the back of an extraordinary year, having delivered one of its strongest performances on record, driven by a potent mix of aggressive central-bank buying, widespread interest-rate cuts, and persistent safe-haven demand. The obvious question for investors now is this: can those gains be sustained, or is the rally starting to look long in the tooth?
The longer-term bullish case for gold remains intact, but the backdrop in 2026 looks noticeably more balanced than it did last year. One of the key shifts is in global monetary policy expectations. After a wave of rate cuts in 2025, markets have begun to reassess how much easing is actually left. Several major central banks are signalling pauses, while others, such as the Bank of Japan, are edging towards further policy normalisation. If the global narrative moves from easing to “less easing” — or even selective tightening — gold loses one of its most reliable tailwinds.
Central-bank demand, a cornerstone of gold’s strength in recent years, is another area of uncertainty. Buying remained solid through 2025, but the pace slowed as prices climbed to record levels. China’s central bank, in particular, has moderated its purchases, raising the risk that elevated prices could deter further accumulation. If major buyers step back, the market may become more vulnerable to profit-taking, especially given how stretched positioning became during last year’s rally.
Geopolitics has also played a decisive role, but here too the picture is mixed. While tensions in Ukraine and the Middle East underpinned gold throughout 2025, signs of de-escalation — alongside improving US-China trade relations — could gradually erode safe-haven demand. That said, risks have not disappeared altogether, with political developments in Venezuela serving as a reminder that geopolitical shocks can re-emerge quickly and without warning.
Read our full gold 2026 outlook here.
Technical gold forecast: Higher highs, higher lows
From a technical analysis point of view, the trend remains constructive with the metal continuing to trade in a clear pattern of higher highs and higher lows, making aggressive bearish calls difficult to justify. As long as that structure remains in place, selling gold aggressively simply doesn’t make a great deal of sense. Traders really need to see a clear bearish signal before considering shorts. While the market does look overbought, that on its own is not a sufficient reason to sell.
Key XAU/USD levels to watch
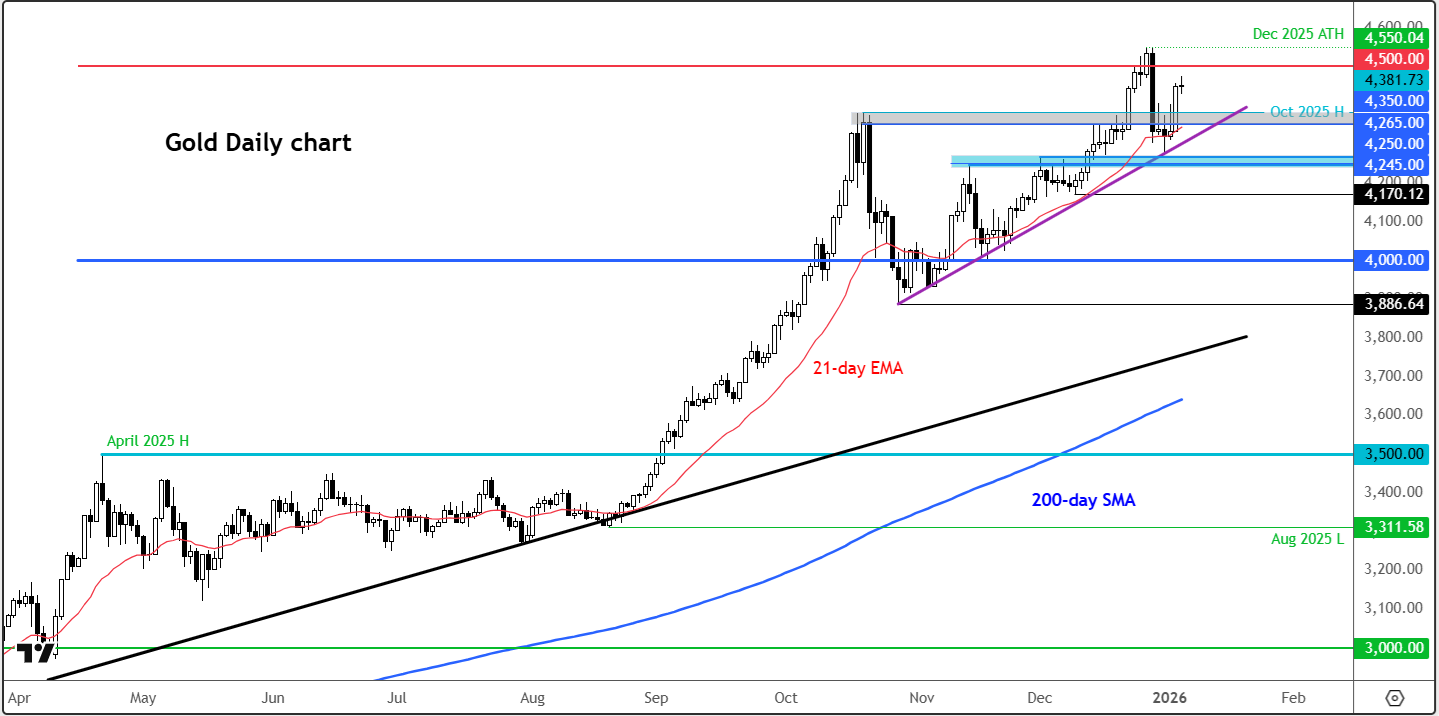
In terms of support, the key area to watch sits between $4,350 and $4,380. This zone, marked in grey on my gold chart, previously acted as solid resistance back in October before gold finally broke higher in December. After a brief move below this region, prices quickly reclaimed it at the start of the year. Because of that, this area should now act as support on any pullbacks. A sustained move back below the zone, however, would leave the bulls on the back foot. In that scenario, we could see a deeper pullback, with the next notable support coming in around $4,250. Below there, there’s very little in the way of meaningful support until the low $4,000s.
On the upside, $4,500 remains the key level to watch. It’s a psychologically important round number, and the sharp sell-off from that level on the 29th of December suggests there’s still some supply sitting up there. Just ahead of it, the December 26th low at $4,469 is also worth keeping an eye on. That level was the final support before the late-December drop, so it wouldn’t be a surprise to see it act as resistance and potentially cap prices before any test of $4,500.
That said, if gold does manage to break and hold above $4,500, the focus then shifts to liquidity above the December all-time high at $4,550. Beyond that, there are no obvious resistance levels on the chart, which brings the next round numbers—$4,600 and $4,700—into view.
In as far as the slightly longer-term technical gold forecast is concerned, key support sits around the $4,000 level, which now acts as an important line in the sand. As long as this holds, the path of least resistance arguably remains higher, with $5,000 still a potential target.
Here is our longer-term technical analysis on gold.

-- Written by Fawad Razaqzada, Market Analyst
Follow Fawad on Twitter @Trader_F_R