Gold Talking Points:
- Gold spent the early portion of last week pulling back, with buyers holding support above the 2600 level from Tuesday through Thursday.
- Another bullish move developed in late-week trade, helping gold to break above a bull flag formation.
- For next week the focus is on higher-low support potential, which brings into play 2650, 2635 and 2622, as looked at in the weekly video.

The rally in gold continues to impress and last week saw the first notable pullback since the episode around the FOMC rate cut in mid-September. But, once again, buyers quickly returned to hold support at a key spot on the chart, and drove right back up towards prior highs.
The move from Thursday into the close was especially clean and I had looked at gold structure early on Thursday, highlighting higher-low support potential from both 2616 and 2611. It was the former level that ended up coming into play to mark the higher-low, after which bulls were off to the races. Impressively – this happened even as US CPI came out above expectations and that extends a streak of strong US data that would normally bring to question rate cut potential. But, at this point, market seem convinced that the Fed is wanting to cut and the combination of Core PCE, NFP and Thursday’s CPI have only served to moderate those rate cut hopes further onto the horizon.
Gold Two-Hour Price Chart
 Chart prepared by James Stanley; data derived from Tradingview
 Gold Near-Term Strategy
It’s interesting but ironically its when price is testing highs or near resistance that buying interest seems to be at its highest. Meanwhile, with pullbacks such as we saw last week, bears will have a tendency to become more vocal. But that could be the best time to investigate bullish exposure as that pullback also opens the door to asymmetry with risk-reward and in this case, it was the 2600 level that remained defended, very similar to what showed in the aftermath of the FOMC rate decision in September.
Notably that rate cut was the first time that 2600 came into play, although it was brief. A near-immediate retracement ensued with price pullback back to test below 2550, which also ended up being brief. It was less than 24 hours later that bulls pushed through the big figure and the corresponding pullback after the breakout couldn’t even make it down to 2600, with a double bottom higher-low showing at 2602.57. I talked about this in the Tuesday webinar while sharing that I was looking for something similar to develop with the more recent pullback that had just gotten underway. At the time, prices had held even above that 2602.57 prior swing low, but the Thursday CPI report came out hot and this was something that could potentially give motive for larger pullbacks, considering that it could delay rate cut expectations around the FOMC.
But that didn’t really happen as the pullback, again, held above 2602.57 and then buyers started to slowly take back control. By the Thursday close bulls had already battled back above 2622 and that move stretched through Friday trade, with price poking out of the topside of a bull flag formation.
Gold Four-Hour Price Chart
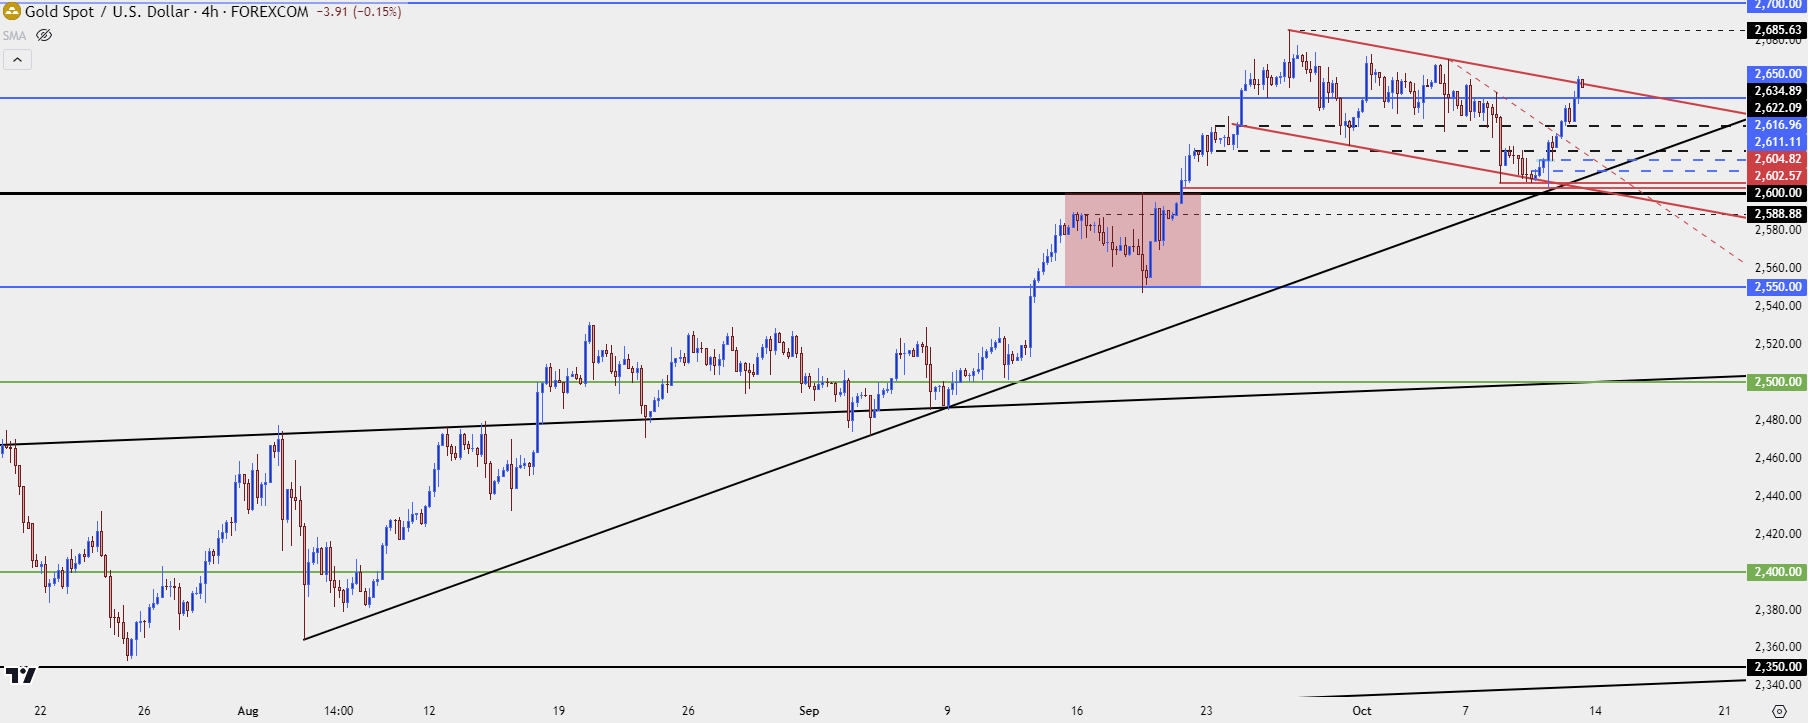 Chart prepared by James Stanley; data derived from Tradingview
 Gold Big Picture
Gold prices remain overbought on both the weekly and monthly chart but, at this point, bulls don’t seem too bothered by that fact. To be sure it’s been a massive year for gold buyers as the metal broke out in Q1 as markets were warming up to rate cut potential around the FOMC; and since then, they haven’t really let up. There was a bit of pullback in Q2 as prices held within a bullish channel but the breakout from that in mid-August hasn’t seen much counter-trend price action.
At this point I see little reason to question the reality of what’s shown in price action over the past two months and, to a larger degree, the past seven months. But, just because the trend has been hot, it doesn’t mean that chasing fresh highs or tests at resistance is a wise move from a strategy perspective.
Instead it’s the pullbacks that can be of interest as this can, at the very least, offer some potential for risk management. If bulls do fail to run with the bull flag breakout, there’s now shorter-term higher-low support potential at 2635 and 2622. If those don’t hold, 2616 and 2611 are still of consideration. And if prices do take out 2600, at that point deeper retracement potential can be investigated. But, for now, buyers have once again shown a strong hand in the move and there’s little reason to question that.
Gold Daily Price Chart
 Chart prepared by James Stanley; data derived from Tradingview
--- written by James Stanley, Senior Strategist