
Key Events
- Investors are balancing profit-taking against ongoing safe-haven demand, keeping gold near the $4,000 mark and silver around $49.
- The DXY’s hawkish tone following the FOMC meeting, alongside progress in U.S.–China trade talks, maintains downside pressure on metals.
Although both gold and silver fell sharply from their 2025 highs, they remain significantly higher year to date—up roughly 69% for silver and 52% for gold.
This keeps the safe-haven demand narrative intact, as investors weigh profit-taking opportunities while cautiously watching for renewed gains toward the $5,000 level.
Still, another steep correction before realigning toward that long-term target remains a valid risk, particularly amid easing trade tensions and the dollar’s hawkish hold.
The Fed’s rate cuts appear largely priced in on the DXY chart, which continues to hold above the 96 support—a 17-year trendline—supporting the dollar’s bullish bias through late 2025.
If precious metals begin to track the dollar’s movements upward again, uncertainty could be resurfacing. Meanwhile, the U.S. government shutdown remains a persistent shadow over the broader market outlook.
While a long-term uptrend scenario remains possible, both market headlines and technical structures currently point to the potential for further near-term weakness before the next sustained rebound.
Technical Analysis: Quantifying Uncertainties
Gold Outlook: 8-Hour Time Frame – Log Scale
Source: Trading view
The 8-hour chart is used here to minimize short-term noise and highlight smoother patterns drawn from daily trends.
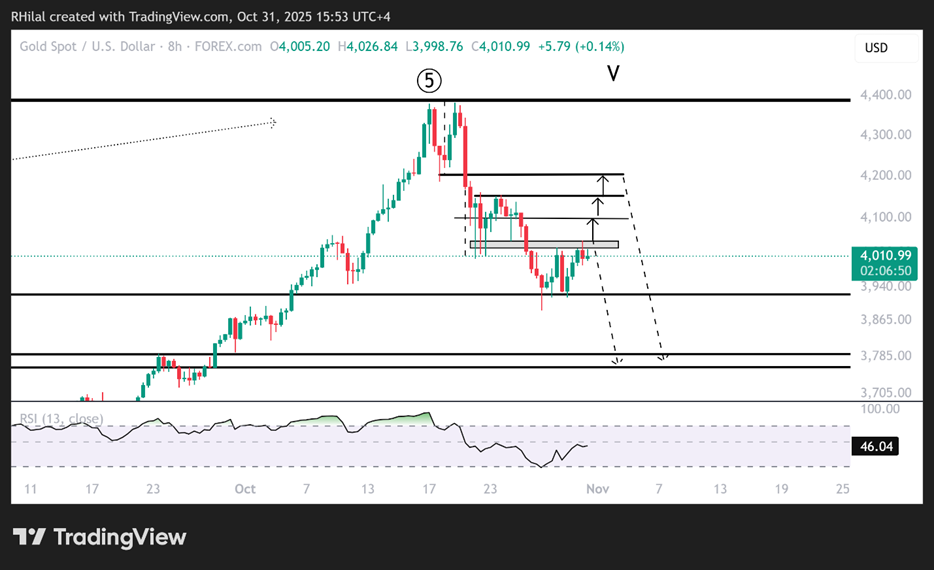
Gold prices are consolidating between $3,900 and $4,040, balancing between buying interest and residual selling pressure. A confirmed break below $3,900 could trigger a deeper decline toward $3,790 and $3,760, with a potential reversal zone emerging afterward. In extreme scenarios, a sustained move below $3,690 could extend losses toward $3,500, the major resistance-turned-support area from 2025.
From the upside, a confirmed close above $4,040 could extend gains toward $4,100, $4,150, and $4,200 before another potential retracement. If these levels hold, the long-term path toward $5,000 may resume.
Gold Outlook: Monthly Time Frame – Log Scale
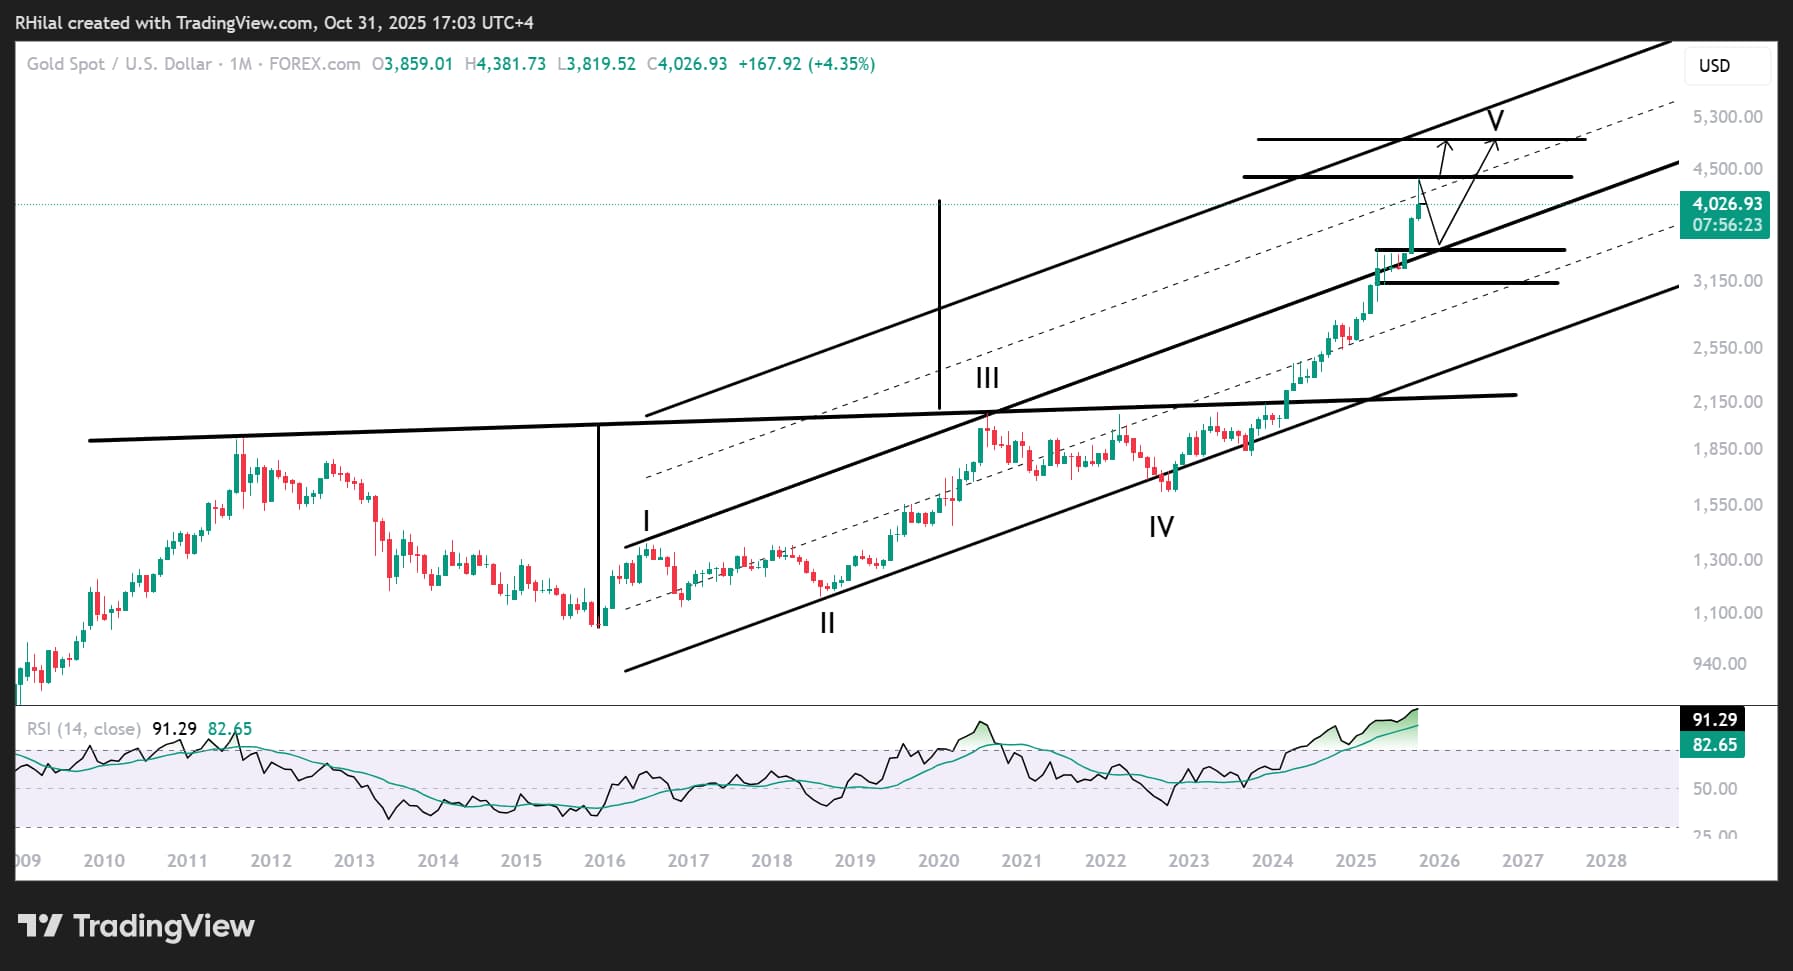
From a monthly perspective, gold has slipped below the mid-zone of a duplicated ascending channel that has been respected since 2016. Given the structure and current overbought momentum, a drop toward $3,500 — aligning with the upper boundary of the nine-year channel — remains possible before the uptrend resumes toward the $5,000 target, especially if the $3,700–$3,690 support zone fails to hold.
Silver Outlook: 8-Hour Time Frame – Log Scale
Source: Trading view
An 8-hour chart is also used for silver to reduce short-term volatility and define smoother directional trends.
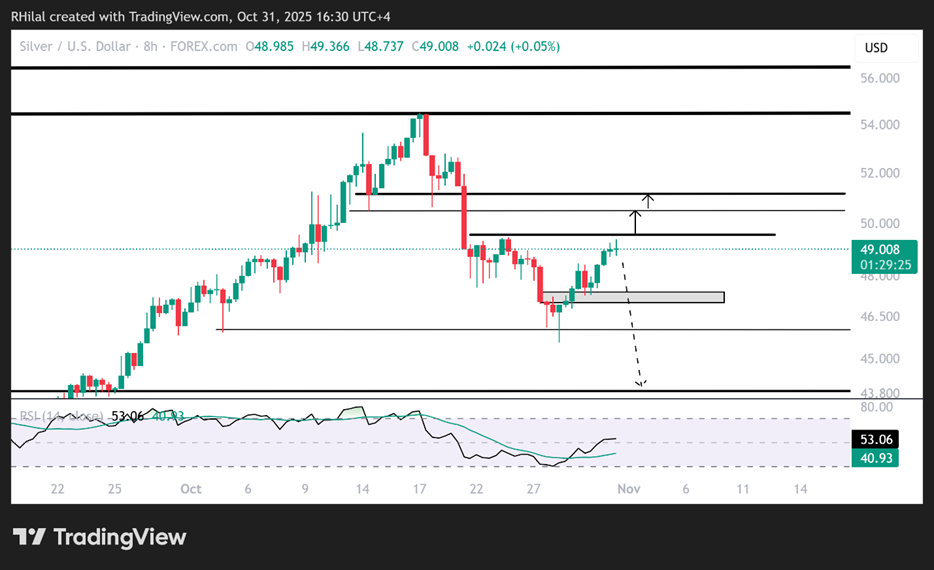
Although the RSI has rebounded from oversold territory and climbed above its mid-range, downside risks remain if prices fall back below $47.
Such a move could extend declines toward $44 and $42, which could later form a potential rebound base.
On the other hand, a confirmed close above $49.60 would likely extend the rebound toward $50.50 and $51.20, before either another short-term correction or a continuation toward the $60 level — the next major technical target.
Silver Outlook: Weekly Time Frame – Log Scale

On the weekly-to-monthly scale, silver’s chart mirrors gold’s pattern — showing a breakout beyond a long-term channel followed by a pullback from the mid-zone of a duplicated pattern, now eyeing the upper boundary of the original channel.
The supports between $44 and $42 align with the upper boundary of a rising channel that has been respected since 2023, connecting a series of higher highs between 2023 and 2024.
This forms a potential support area for any near-term price declines, especially as the market continues to struggle with overbought momentum on higher time frames.
If this structure holds, silver could later resume its broader upward trajectory toward the $60 level, the upper boundary of the duplicated channel.
Written by Razan Hilal, CMT
Follow on X: @Rh_waves