Japanese Yen, USD/JPY Talking Points:
- Last week saw an aggressive sell-off in USD/JPY after the pair touched the 160.00 level to begin the week.
- There was another massive move after the FOMC rate decision that’s been widely-attributed to another BoJ intervention. USD/JPY pushed all the way down to 151.95 before finding support, which was resistance in both 2022 and 2023. Since then, bulls have been driving a short-term pattern of higher-highs and higher-lows.
- I’ll be discussing these themes in-depth in the weekly webinar. It’s free for all to register: Click here to register.

Last week’s weekly bar in USD/JPY completed as a bearish outside pattern as last week took out the entirety of the prior week’s range. There is some context here, however, as it was the early-week jump to 160.00 that elicited the intervention from the Bank of Japan. And while bulls were on their way back in the early portion of last week, another suspected intervention after the FOMC rate decision on Wednesday further shook the branch to frighten carry traders out of positions.
I had looked at this on Thursday just after the FOMC move, and as I highlighted there was a big spot of possible support on the horizon at the 151.95 level. This was the spot that had held the highs in Q4 of 2022 and 2023; and as of last Friday, it had become support at prior resistance while also helping to set the weekly low.
USD/JPY Weekly Price Chart
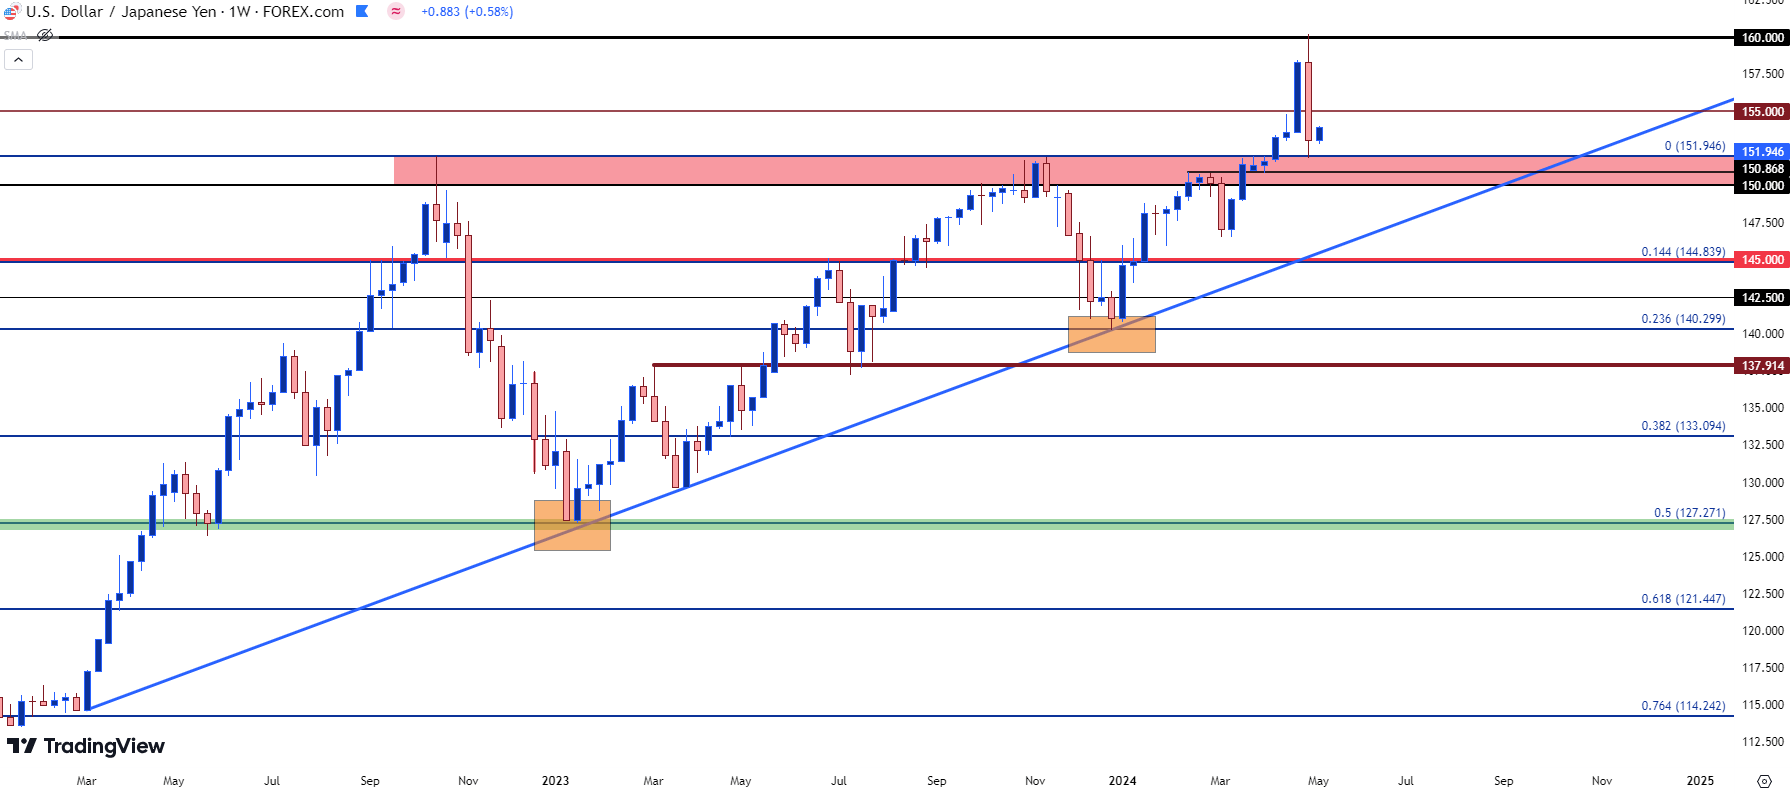
Chart prepared by James Stanley, USD/JPY on Tradingview
From the daily chart we can get a better view on that support test last week. The low of 151.95 printed just after the Non-farm Payrolls report, at which point prices began snapping back. From the weekly chart above, that presents a possible higher-low; but given the context of the daily where a trend had developed above prior resistance, there’s an even larger question mark.
The 155.00 level remains key and there could even be another possible intervention risk at that level. If the BoJ/Ministry of Finance wanted to send a statement, that would probably be the level that they wanted to defend rather than waiting for another 160.00 print.
That may sound out of the norm for a traditionally conservative Central Bank, but so would an intervention after the FOMC rate decision even though USD/JPY hadn’t re-tested 160.00.
The price of 155.00 was previously a stall point in the trend with the fear of a possible intervention above that, and that scenario may be back in-play. For resistance, that spot looms large and above that, there’s a prior swing-low that helped to form resistance when price was on its way down last week, and that plots at 156.07.
Underneath support, there’s two areas of interest for bullish scenarios and the 150.00 level is somewhat obvious. But above that is another prior swing of resistance-turned-support and that plots at 150.87.
USD/JPY Daily Price Chart
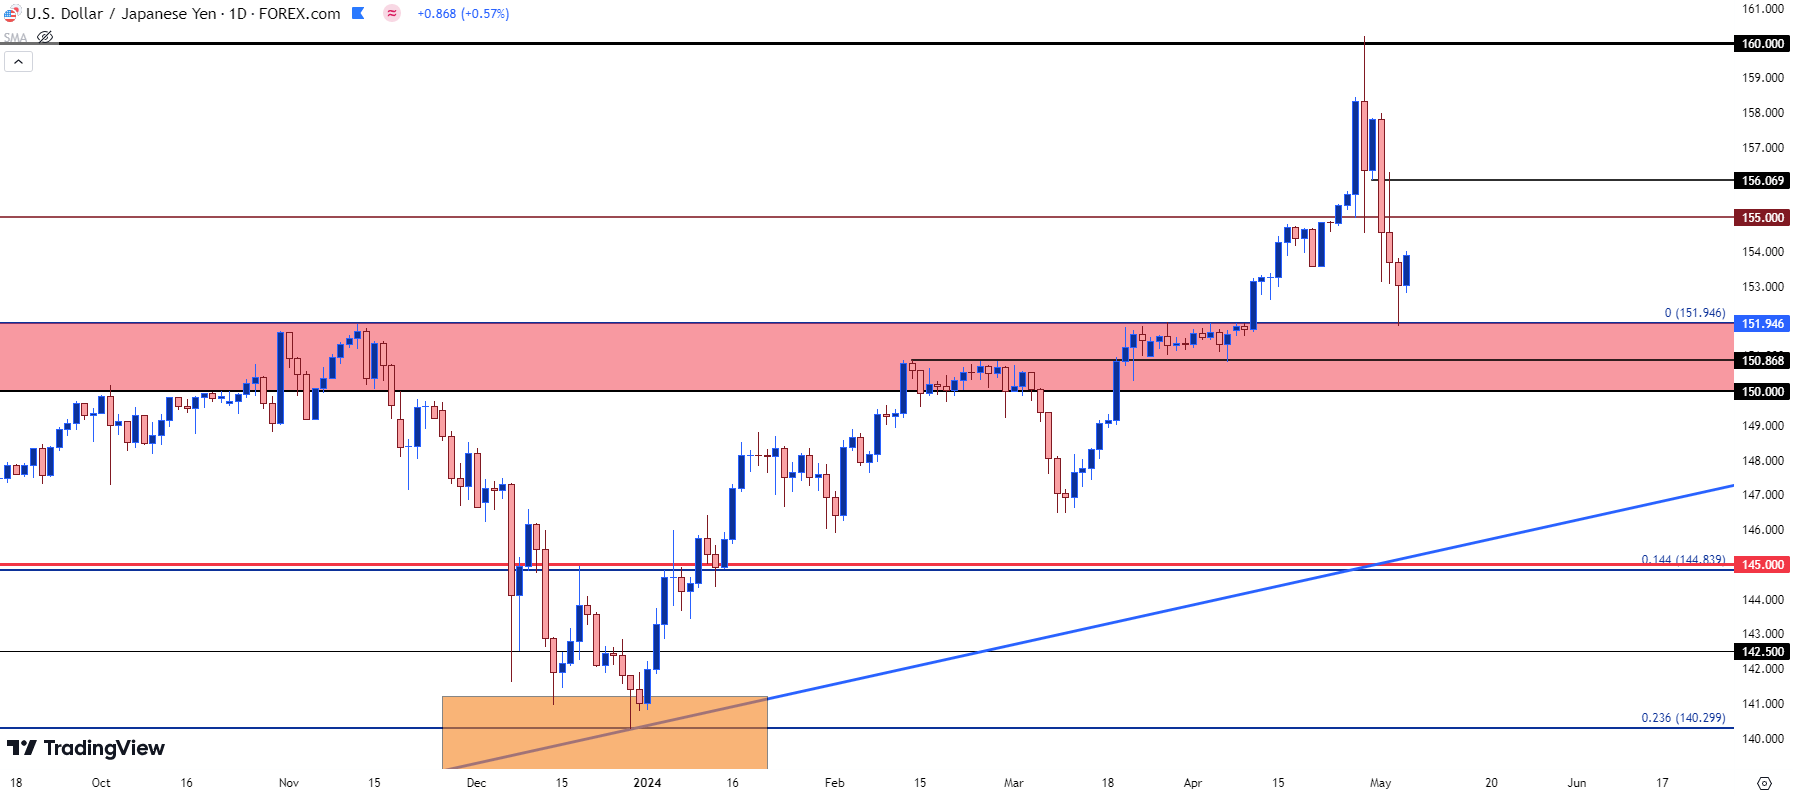 Chart prepared by James Stanley, USD/JPY on Tradingview
USD/JPY Shorter-Term
So far in early trade this week, bulls have been pushing higher-highs and higher-lows. And as discussed last week, both after the intervention on Sunday night and the suspected intervention after the FOMC, the fundamental backdrop remains of issue for bears.
Rollover still favors the long side of the pair and this means that longs can earn rollover credits while shorts have to pay rollover debits, and this could also constrain bearish trends in the pair as any stall in the move would have an associated cost for sellers and possible benefit for bulls.
The big fear on the long side at this point would be another entrance from the Bank of Japan; and, bigger picture, for USD/JPY bears it would seem the big hope would be a sell-off or reversal in the U.S. Dollar. That was what drove reversal themes in the pair in Q4 of the past two years and if the USD is selling off on a broader basis, there could be a percolating fear of carry trades taking on principal losses. And that could motivate carry traders to close positions.
From the four-hour chart below, we can get view of that shorter-term bullish sequence that’s built since last week’s 151.95 test. There’s a higher-low just above prior resistance at 153.39, and below that a spot around 152.76.
USD/JPY Four-Hour Price Chart
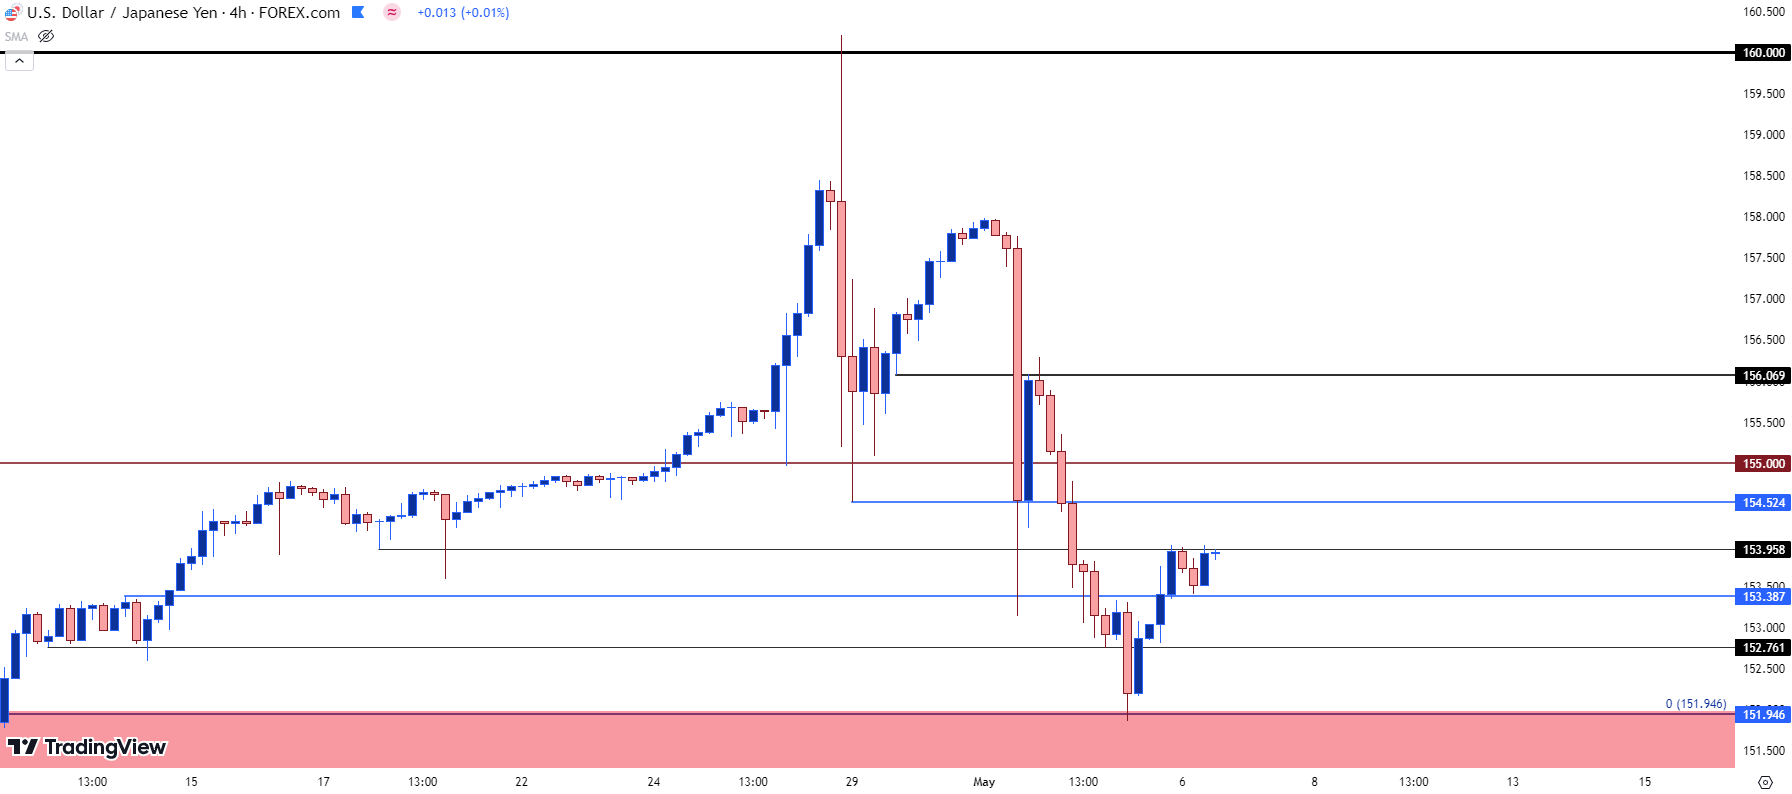 Chart prepared by James Stanley, USD/JPY on Tradingview
--- written by James Stanley, Senior Strategist