
Key Events
- Nasdaq and gold lag below 25,700 and 4,150 as Dow and silver approach record highs near 48,000 and 52.
- Key resistance levels are now in sight, likely to define whether precious metals experience another drop or a breakthrough as we move toward year-end.
Silver & Gold Outlook: Daily Time Frame – Log Scale
Source: Tradingview
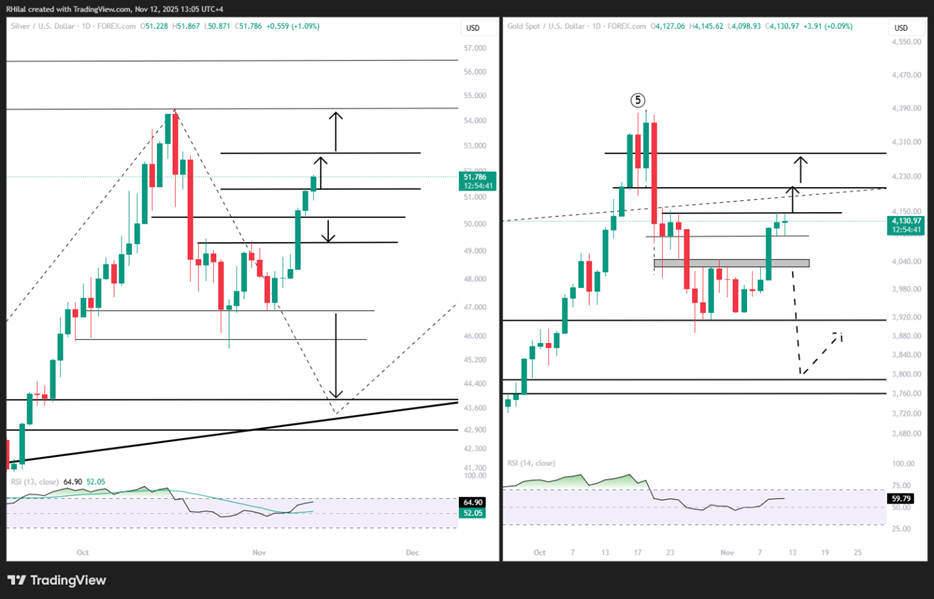
On the daily time frame, silver is maintaining a steeper and more consistent recovery than gold, eyeing the 52 level and record highs. Gold, by contrast, remains capped below the 4,150 resistance, giving silver the relative strength advantage and potential confirmation lead.
Previously, when silver reached its record near 54.30, gold was still consolidating below 4,380, signaling a possible topping pattern for silver ahead of gold.
However, if both metals manage to break through their respective resistance levels, another bullish phase could unfold for the year, with silver eyeing the $60 range and gold potentially redirecting its trend toward $5,000.
The following scenarios stand out:
Silver Outlook: Daily Time Frame – Log Scale
Source: Tradingview
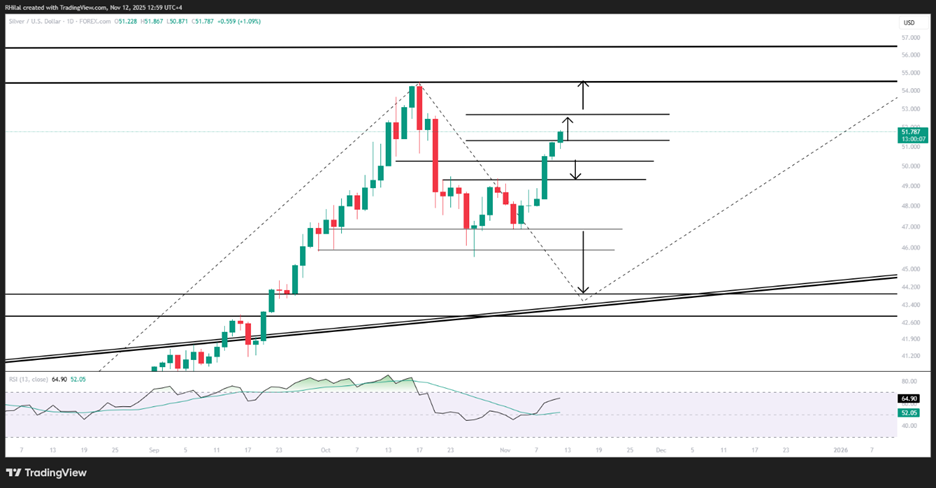
Silver continues to recover steadily from the 45.50 low, advancing toward the 52 mark. Key resistance levels remain at 52.00, 52.17, and the 54.30 record high.
A sustained close above these levels could redirect the broader trend toward new records, with potential targets near 57.00 and 63.80, based on longer-term weekly chart structures.
Despite this strength, the current rebound may still represent a corrective phase within a broader precious metals consolidation following the 2025 rally.
Short-term support zones are observed near 51.30, 50.30, and 49.30. A renewed dip below 49.30 could reintroduce the risk of a deeper correction toward the 44–42 zone before a more definitive recovery takes hold.
Silver Outlook: Weekly Time Frame – Log Scale
Source: Tradingview
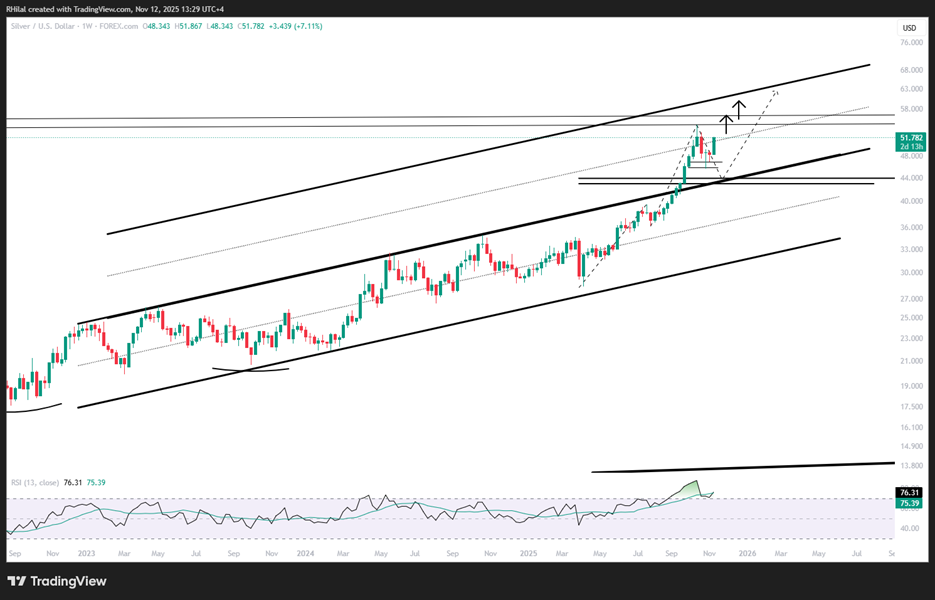
From a weekly perspective, silver’s price action remains decisively above a parallel channel extending from 2023. If another decline occurs below 49.30 and 45.00, the long-term critical support zone lies between 44.30 and 42.90. This region aligns with the trendline connecting consecutive higher highs from 2023 to 2024 and corresponds to the 0.236 Fibonacci retracement of the broader uptrend between the 2022 trough at 17.55 and the 2025 peak at 54.30.
On the upside, a sustained hold above the mid-zone of the duplicated channel and the yearly high at 54.30 could fuel further gains toward the upper boundary of the channel, with targets at 57.00 and 63.80, respectively.
Long-Term Structure: 45-Year Pattern, 3-Month Time Frame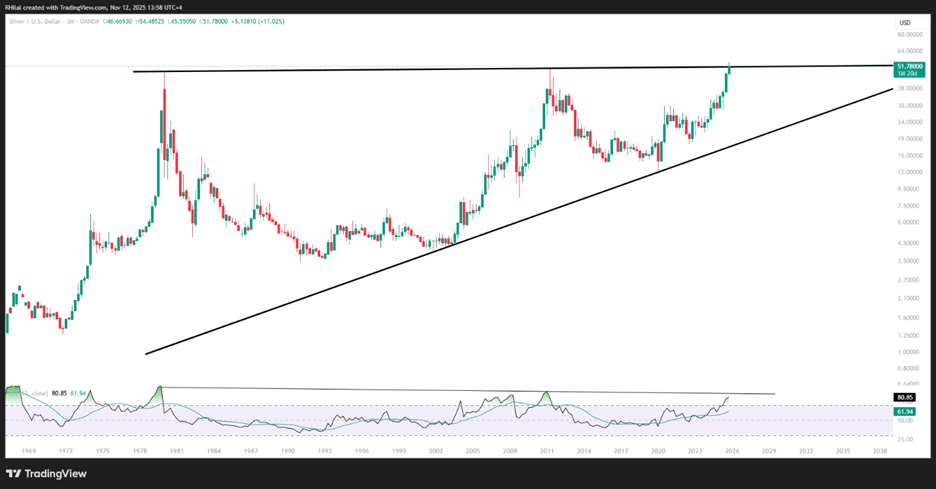
Source: Tradingview
The significance of the 2025 high in silver lies in its alignment with a 45-year resistance trendline extending from the 1980s.
A monthly close above the 54.30 record would mark a decisive breakout beyond this multi-decade structure, potentially extending silver’s trajectory toward triple-digit levels — possibly outpacing gold — as global industrial demand and technological innovation continue to expand silver’s strategic role.
Written by Razan Hilal, CMT
Follow on X: @Rh_waves