
FX markets are trading in typically subdued fashion ahead of Nonfarm Payrolls, although implied volatility suggests traders still expect sizeable moves once the data hits. USD/JPY remains sensitive to further intervention fears near 158, while GBP/USD is showing signs its multi-week rally is losing momentum. Here are the key technical setups to watch into NFP.
View related analysis:
- AUD/USD, NZD/USD Extend Gains, Though AUD/NZD Flashes Reversal Risk
- USD/JPY Plunges from 158 as Yen Surges on Another Suspected Intervention
- FX Futures Positioning: USD, USD/JPY, GBP/USD, AUD/USD | COT Report
- US Dollar Outlook: Bullish May Seasonality Meets Volatility Risk
USD/JPY and GBP/USD Price Action Setups Ahead of NFP
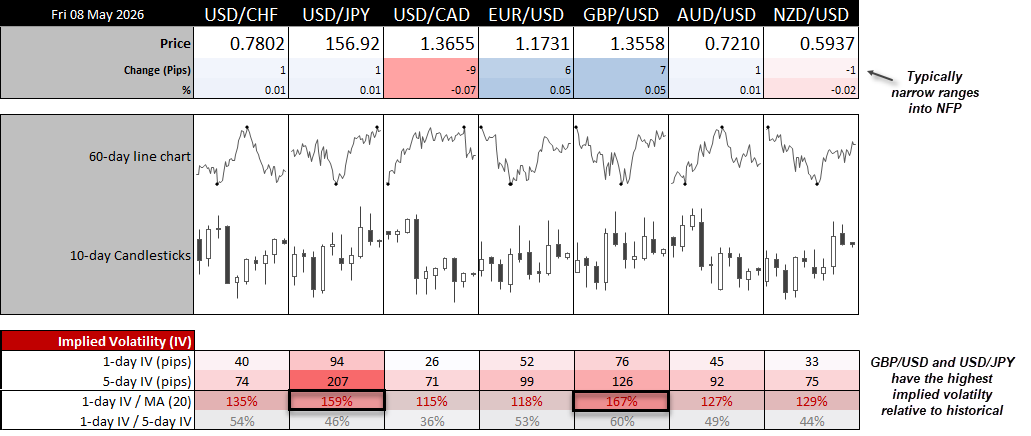
FX Volatility Muted Ahead of NFP, Though GBP/USD and USD/JPY Stand Out
We’re seeing the usual minuscule ranges across FX majors on NFP day, with little reason to expect sudden moves without a surprise catalyst. Looking across implied volatility levels for the FX majors shows traders expect the most action in the British pound and Japanese yen. The 1-day IV for GBP/USD sits at 76 pips, equivalent to 167% of its 20-day ATR. For USD/JPY, 1-day IV sits at 94 pips (up or down), or 159% of its 20-day ATR. Do note, however, that 1-day IV for all FX majors is currently above 100% relative to their ATR(20).
Source: LSEG
USD/JPY Technical Analysis: US Dollar vs Japanese Yen
USD/JPY Drifts Higher After Intervention Shock, But Downside Risks Remain
Needless to say, there has been a decent amount of volatility on USD/JPY, most likely due to Japan’s Ministry of Finance (MOF) intervening in the yen at least twice since last Thursday. That has produced two notable selloff sessions, although prices are once again drifting higher during quieter trade.
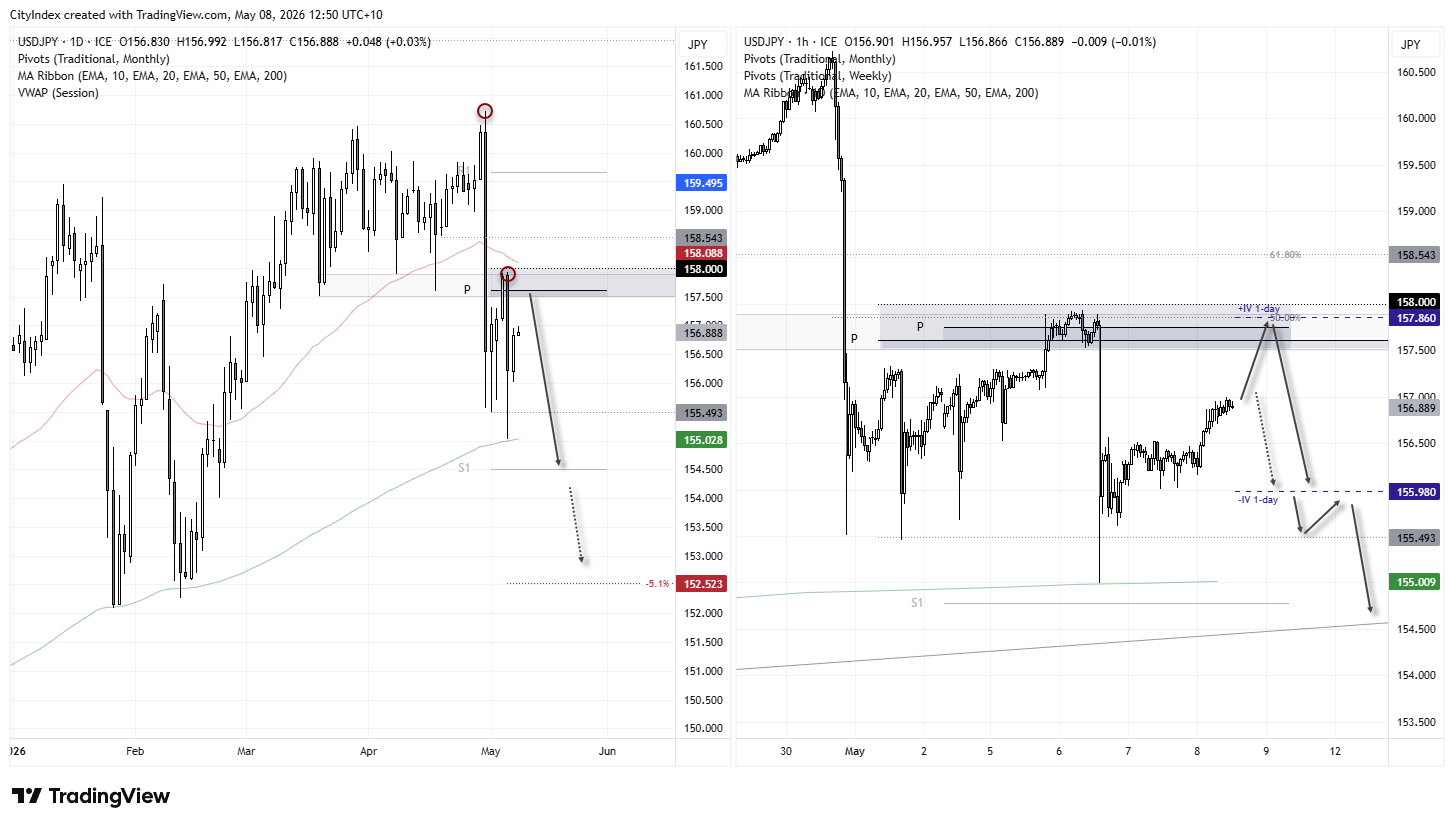
Given the most recent suspected intervention occurred just below 158, that level could become self-fulfilling resistance as bulls err on the side of caution should prices move back towards it. I outlined my reasoning for a much deeper decline in prior yen articles, largely because previous interventions have coincided with multi-week or multi-month declines. Even a smaller post-intervention move of -5.1% could send USD/JPY down to 152.52, while a -7.8% decline would target 148.19. A move below 140 could even come into view if we see a repeat of some of the double-digit declines witnessed throughout history.

USD/JPY Rebound Faces Heavy Resistance Around 158
The 1-hour chart shows prices drifting higher, but with so many technical levels around the 158 level – it seems a swing high up to or around that level could be likely. Between 157.50 – 15 we have the monthly and weekly pivot points, the upper 1-day IV, 50% retracement and prior support / resistance zone. So even if a strong NFP numbers are delivered, it could be a last hurrah before momentum turns and USD/JPY heads back towards the 200-day EMA around 155.
Source: ICE, TradingView
GBP/USD Technical Analysis: British Pound vs US Dollar
GBP/USD Rally Losing Momentum Beneath February VPOC
The British pound has staged a decent rally since the April low, with GBP/USD rising as much as 3.8% by last Friday’s high. However, much of that rally occurred over an eight-day period, and bullish momentum has clearly faded over the past three weeks.
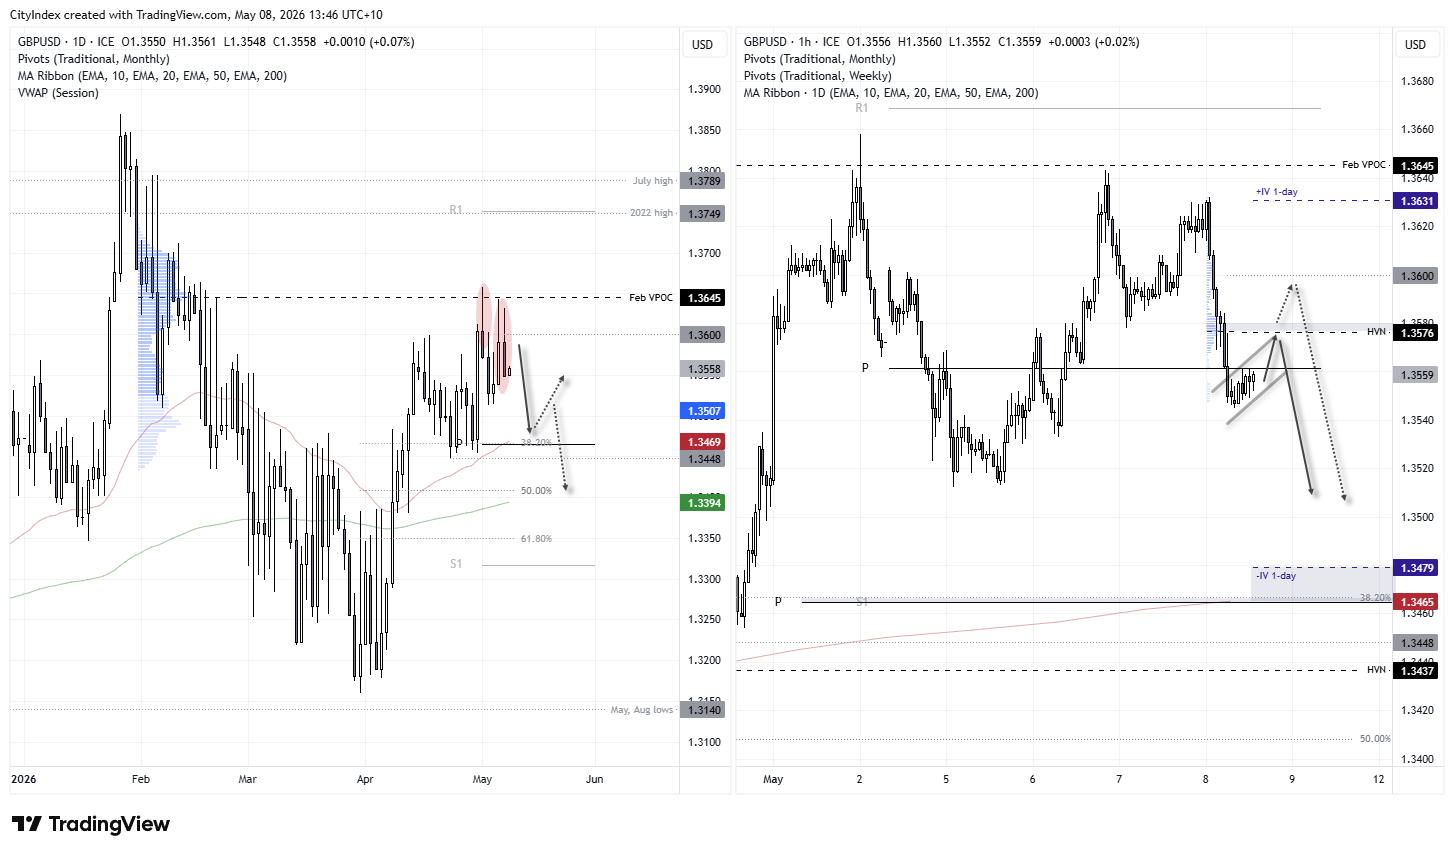
The fact the rally stalled around the February VPOC and may have since formed a lower high also hints at a downside move for GBP/USD. Note the three large upper wicks across the past five candles, suggesting bulls continue to lose momentum beneath the VPOC, while Thursday’s bearish inside candle also warns of a potential dip lower.
A move towards the 50-day EMA (1.3470), monthly pivot point (1.3465), or the 1.3448 swing low could now be on the cards.

GBP/USD Risks Further Weakness as Bear Flag Emerges
The 1-hour chart shows momentum turning sharply lower on Thursday. A small retracement — possibly a bear flag — is now forming near the cycle lows. Were it not for NFP, I would be more inclined to expect a clean breakdown, although the risk of another drift higher remains apparent.
Note the high-volume node (HVN) at 1.3576, which could act as resistance. Otherwise, I would look for evidence of a swing high towards 1.3600 on the assumption of a move lower towards 1.3470, near the 38.2% Fibonacci retracement level and 50-day EMA.
Source: ICE TradingView
View the full economic calendar
-- Written by Matt Simpson
Follow Matt on Twitter @cLeverEdge