US Dollar, EUR/USD, FOMC, CPI Talking Points:
- As expected, it’s been a big day for markets with the morning release of CPI leading into the FOMC rate decision.
- CPI came in below expectations, giving hope that the Fed may be able to cut rates at some point this year. But the dot plot matrix showed a more cautious FOMC with the forecast now moving to a single cut expected for 2024, although markets are still pricing in the possibility of two to a 62.6% probability.
- I’ll be discussing these themes in-depth in the weekly webinar. It’s free for all to register: Click here to register.

It’s been a busy day across markets and at this point, the net has been a strong move in both the Nasdaq and S&P 500 with the Dow Jones continuing to lag.
Starting the US session was another release of CPI data and both core and headline printed below expectations. Headline inflation printed at 3.3% v/s an expectation of 3.4% and core CPI came in at 3.4% against the 3.5% expectation. This represents the lowest read in core CPI in over three years, and despite that data point still being far away from the Fed’s 2% target, it came as a relief to markets after a supercharged NFP report last week.
Core CPI Chart - Releases since January, 2023

Chart prepared by James Stanley
This had a near-immediate impact across the FX market with a decisive move of USD-weakness pricing-in. The US Dollar dropped directly to the next zone of support that I had looked at in yesterday’s webinar, between Fibonacci levels at 104.26 and 104.38. The bottom of that zone held the lows into mid-day, at which point the FOMC stole the focus. On the 30-minute chart below, we can see the fast and aggressive drop that drove all the way to the 104.25 level.
US Dollar 30-Minute Price Chart
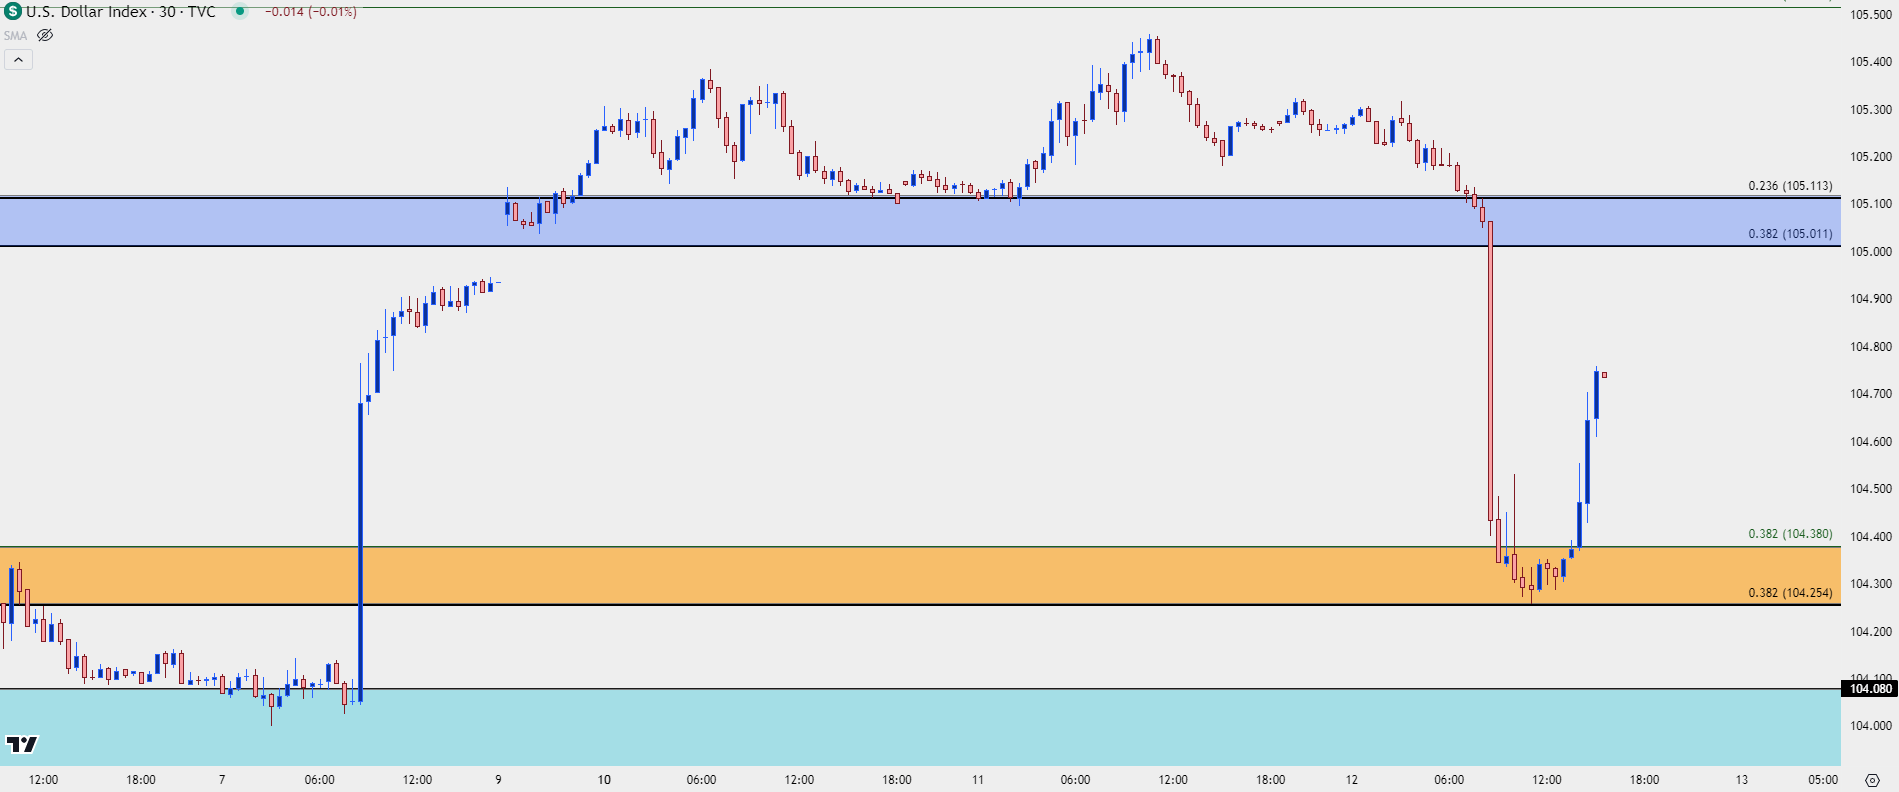 Chart prepared by James Stanley; data derived from Tradingview
From the daily chart of the USD, we can see that the net impact of the day’s drivers was a negative. But – there was aggressive defense of the Fibonacci level and at this point, the US Dollar is holding above the 200-day moving average.
This also represents the possibility of a higher-low. Last week saw support grinding at a key spot on the DXY chart from 103.88 up to 104.08, as the April and May lows, respectively. That held long enough to move into the NFP report which provoked a very strong move in the US Dollar.
So, there could remain bullish scope from a technical perspective as defined by both the 200-dma hold and the potential higher-low. The bigger question will be one of counterparts and whether we see Euro or Yen bears returning EUR/USD and USD/JPY.
US Dollar Daily Price Chart
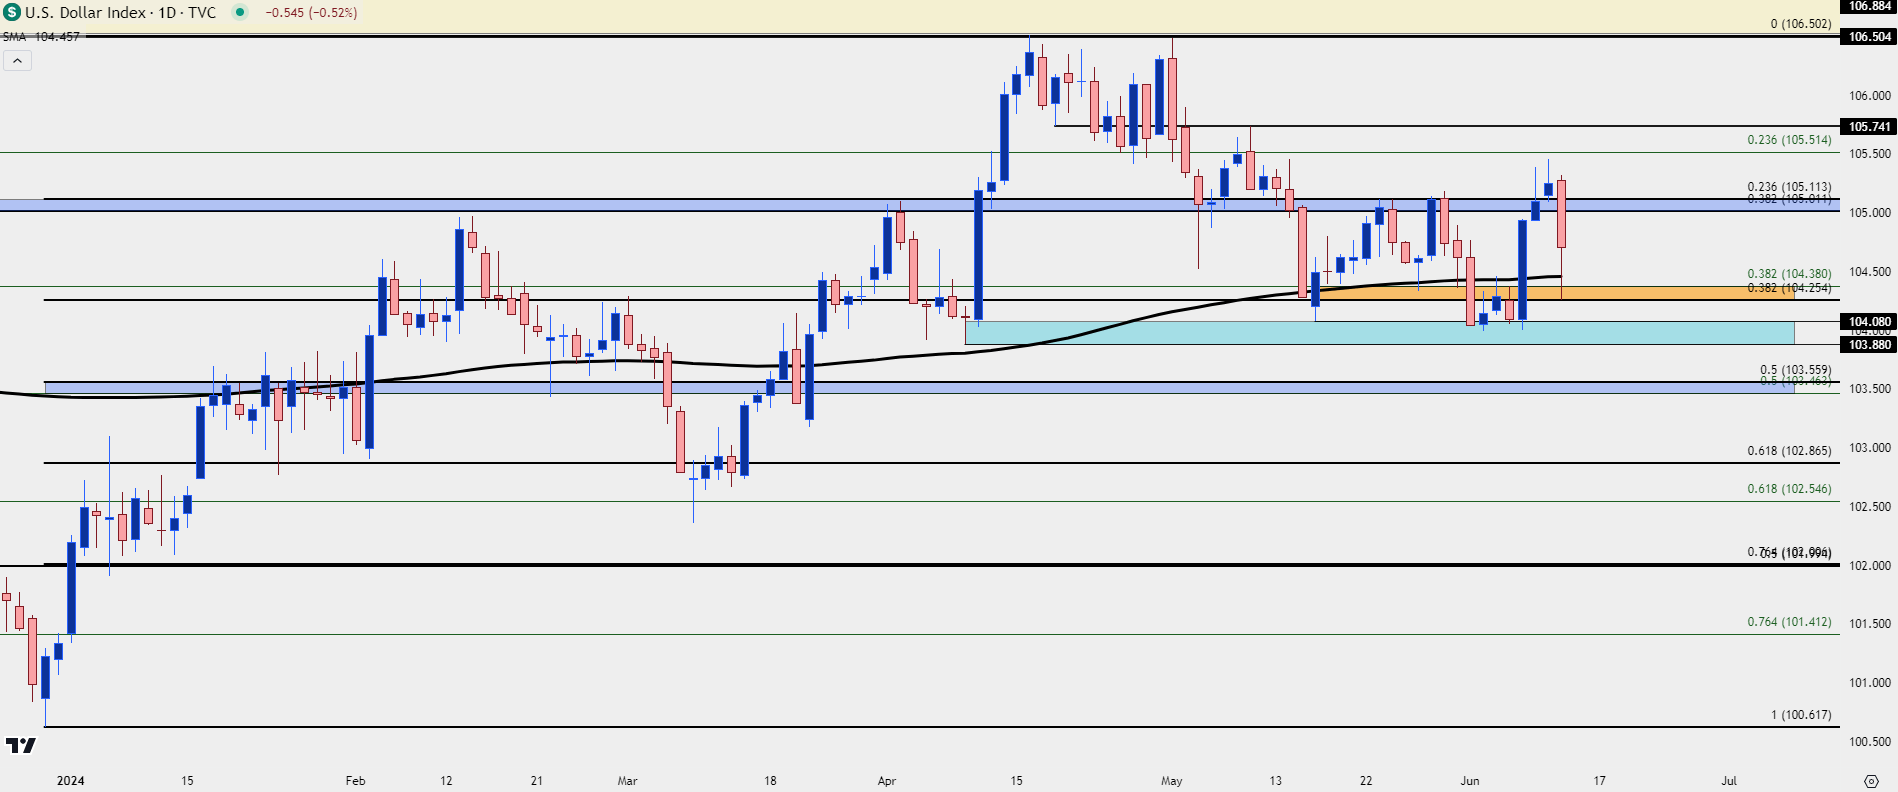 Chart prepared by James Stanley; data derived from Tradingview
EUR/USD
It’s been a dramatic couple of days in EUR/USD, so I wanted to start off with the big picture first to put it into perspective. From the weekly chart the 17-month range remains in-place, and we’re pretty much near the middle of that range as defined by the move that posted from last July-October.
The 50% retracement of that move is at 1.0862 and that was holding resistance for the past four weeks, until the bearish move that appeared around NFP last week.
EUR/USD Weekly Price Chart
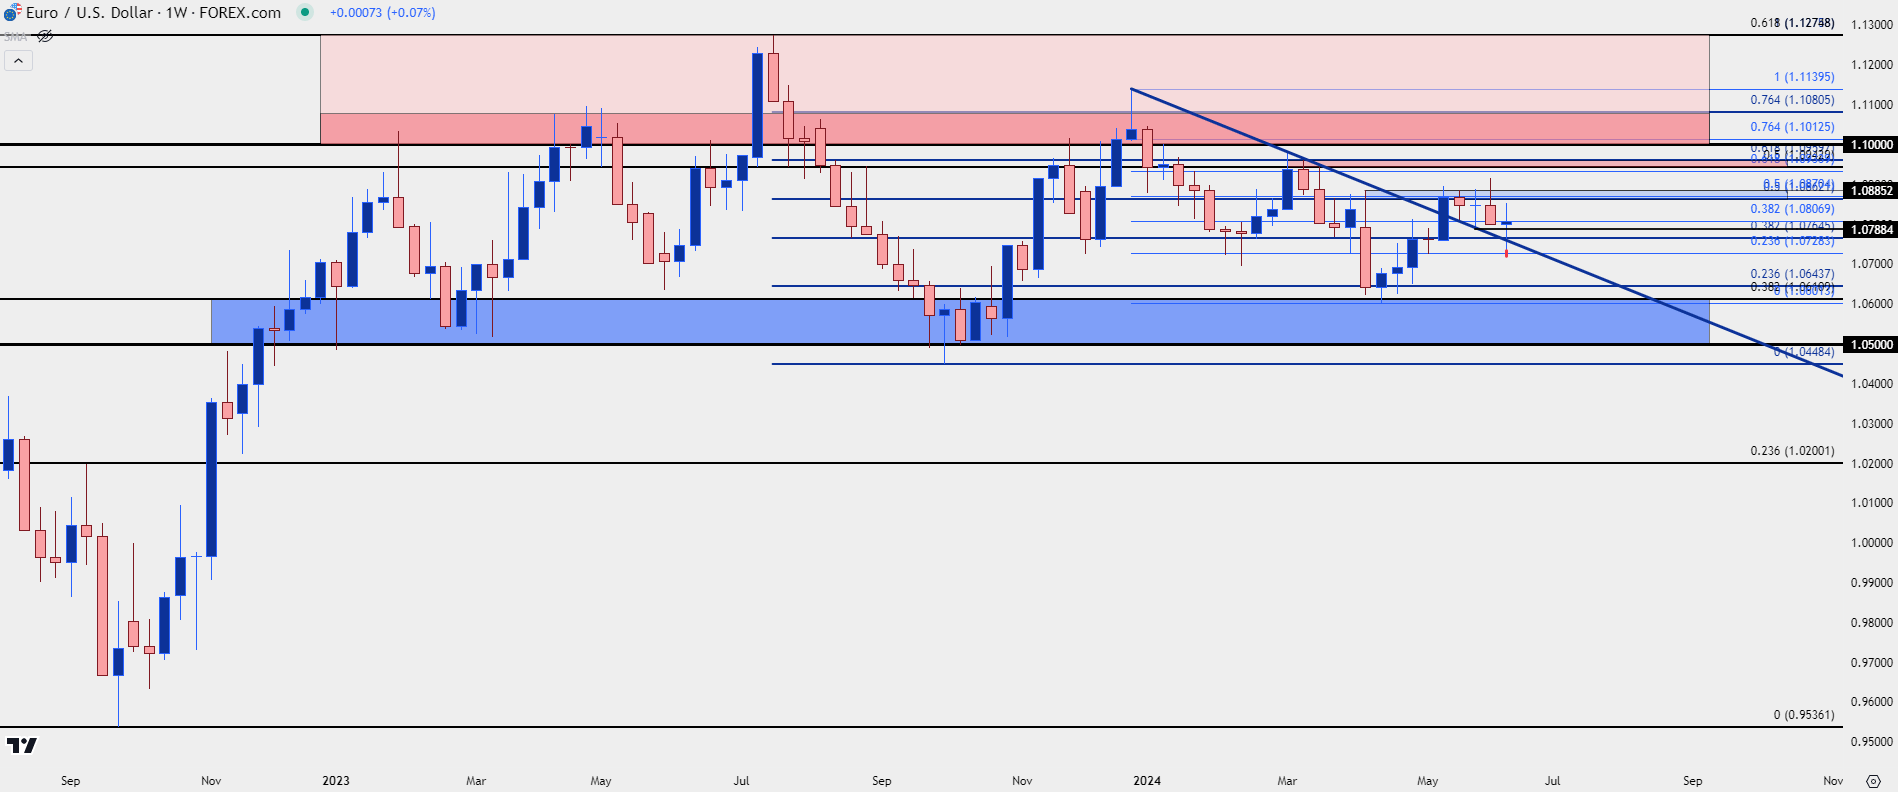 Chart prepared by James Stanley, EUR/USD on Tradingview
I wanted to start off longer-term with EUR/USD as the daily chart appears messy to me. The sell-off on the back of NFP was fast and consistent, but as I shared in the Tuesday webinar, it was almost too fast as RSI divergence had begun to show as EUR/USD was starting to test the Fibonacci level at 1.0728.
That divergence highlighted an oversold backdrop and as the CPI data came in this morning, EUR/USD posted an aggressive snap-back move. And, as you can see from the below chart, the hawkish twist at the FOMC helped to ease that a bit – but – there’s still a case for bullish structure here as we have a fresh higher-high on the back of this morning’s breakout. Price is currently testing the Fibonacci level at 1.0807 and there’s the 200-day moving average a little lower, around 1.0786.
With the Fed dialing back expectations for cuts this year, the big question now is whether the ECB can hold the line. At their rate cut last week they remained evasive around future cuts and if that remains the case, there can be seen a degree of balance between the Central Banks. But if buyers fail to hold above the 200-dma that bullish case begins to weaken.
EUR/USD Four-Hour Price Chart
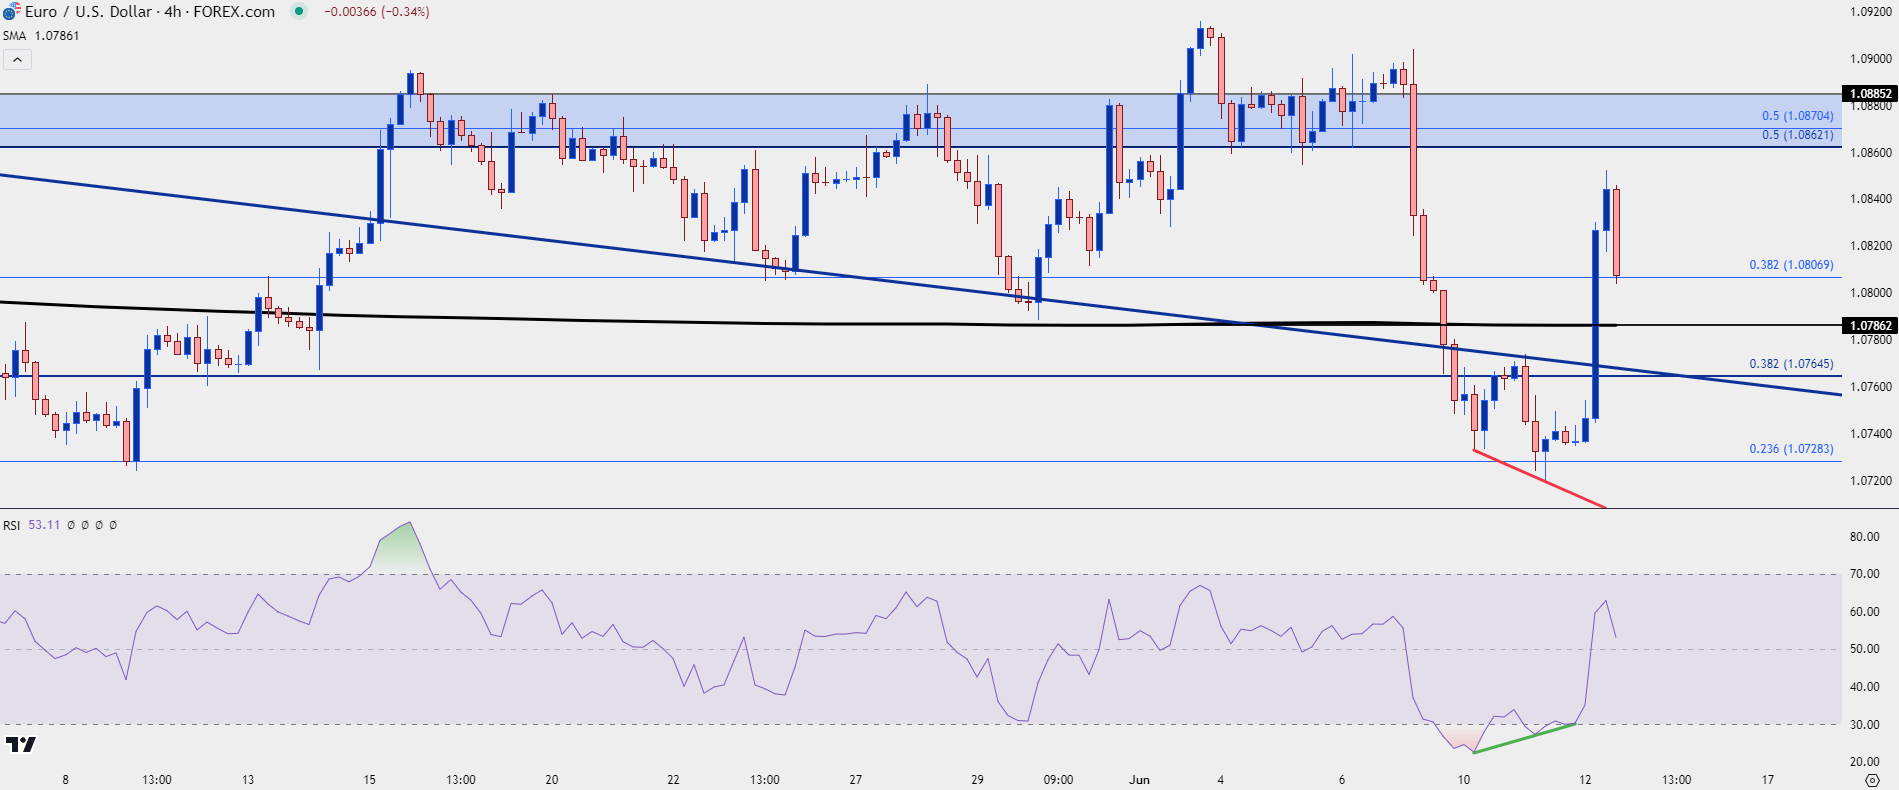 Chart prepared by James Stanley, EUR/USD on Tradingview
USD/JPY
The week isn’t over yet. Tomorrow morning brings PPI data out of the United States for another perspective on inflation, and then tomorrow night (Friday morning in Asia) brings the Bank of Japan rate decision.
The Yen is a 13.6% component of the DXY basket so it’s very much possible to see some Dollar-drive from that meeting. There’s been a percolating rumor through multiple news agencies that the Bank of Japan is contemplating a cut to their bond buying program, and when a report is that widely disseminated it becomes that much more interesting.
In USD/JPY, the pair has continued to oscillate inside of last month’s range, with a tightening effect over the past couple of weeks as price has attempted to find equilibrium around the 156.00 level.
The daily bar is descriptive, and I think this represents an interesting comparison to the USD daily bar above. With a little more than an hour to the daily close, the daily candle of USD/JPY is bearish, but mostly underside wick. We can see the sell-off from CPI largely being erased on the back of the FOMC rate decision.
So, if the BoJ does want to provoke a larger reversal move, they’re going to have to frighten carry traders out of the position and given that the Fed retained a more-hawkish view today, the bar for the BoJ has just been raised a bit more.
USD/JPY Daily Price Chart
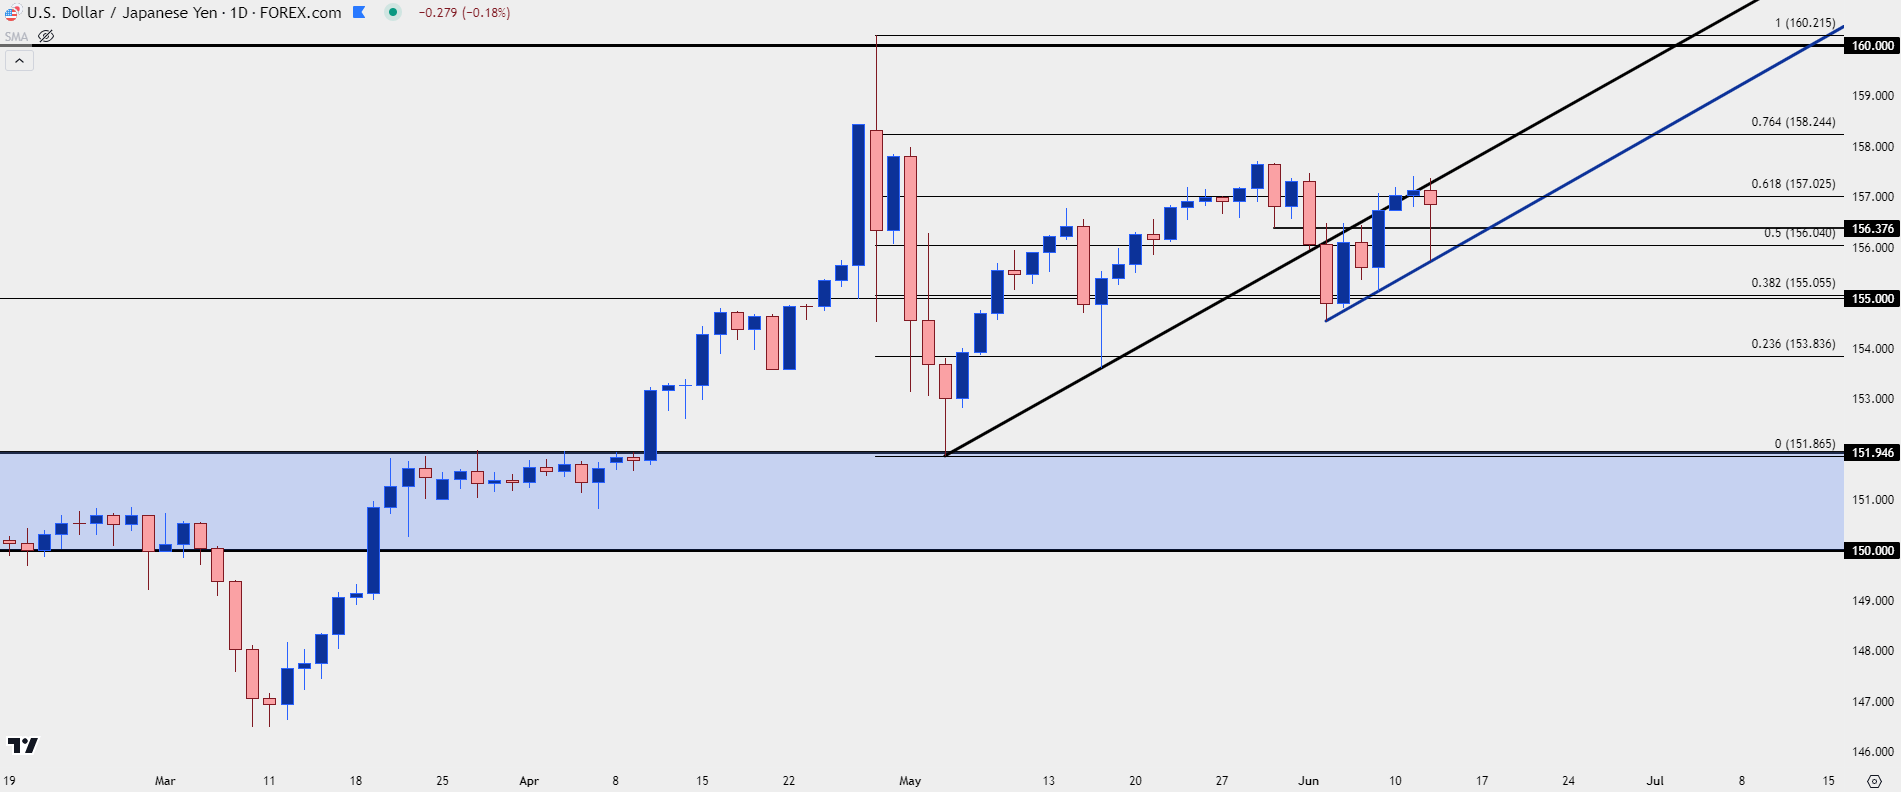 Chart prepared by James Stanley, USD/JPY on Tradingview
--- written by James Stanley, Senior Strategist