US Dollar Outlook: USD/CHF
USD/CHF extends the rebound from the weekly low (0.7911) to snap the recent series of lower highs and lows, but the exchange rate may continue to track the negative slope in the 50-Day SMA (0.8104) as it still holds below the moving average.
USD/CHF Bounces Back Ahead of Monthly Low
USD/CHF bounces back ahead of the monthly low (0.7872) to keep the Relative Strength Index (RSI) out of oversold territory, and the exchange rate may further retrace the decline from the start of the week as there appears to be a broad-based recovery in the US Dollar.
Join David Song for the Weekly Fundamental Market Outlook webinar. David provides a market overview and takes questions in real-time. Register Here
As a result, USD/CHF may stage further attempts to test the former support zone around the April low (0.8040) ahead of the Federal Reserve interest rate decision on July 30, but the recent rebound in the exchange rate may turn out to be temporary as the central bank remains on track to further unwind its restrictive policy in 2025.
With that said, recent price action raises the scope for a larger rebound in USD/CHF as it no longer carves a bearish price series, but the exchange rate may continue to downward trend from earlier this year should it continue to track the negatives slope in the 50-Day SMA (0.8104).
USD/CHF Price Chart – Daily
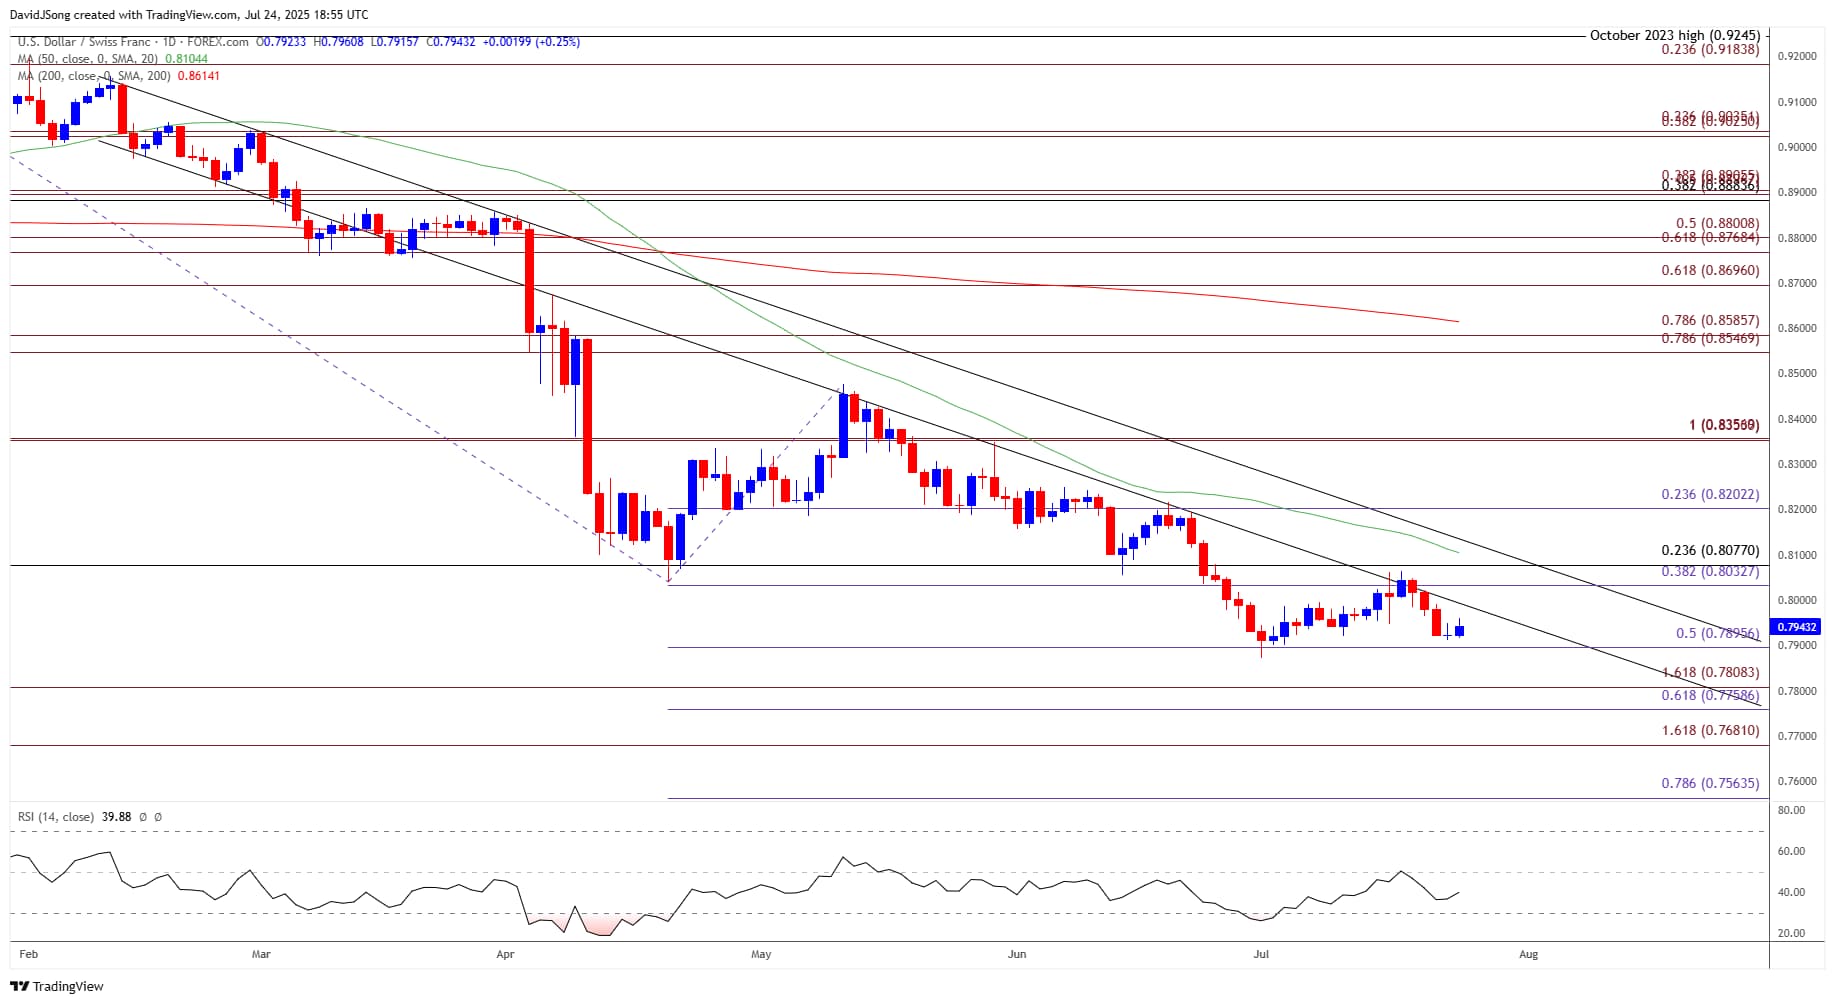
Chart Prepared by David Song, Senior Strategist; USD/CHF Price on TradingView
- USD/CHF appears to be defending the monthly low (0.7872) as it no longer carves a series of lower highs and lows, and the exchange rate may stage further attempts to test the former support zone around the April low (0.8040) should it continue to retrace the decline from the monthly high (0.8064).
- Need a move/close above the 0.8030 (38.2% Fibonacci extension) to 0.8080 (23.6% Fibonacci retracement) zone for USD/CHF to threaten the negative slope in the 50-Day SMA (0.8104), with the next area of interest coming in around 0.8200 (23.6% Fibonacci extension).
- However, lack of momentum to hold above 0.7900 (50% Fibonacci extension) may lead to a test of the monthly low (0.7872), with a move/close below the 0.7760 (61.8% Fibonacci extension) to 0.7810 (161.8% Fibonacci extension) region opening up 0.7680 (161.8% Fibonacci extension).
Additional Market Outlooks
US Dollar Forecast: USD/JPY Struggles amid Failure to Test April High
AUD/USD Bounces Back Ahead of June Low to Register Fresh Yearly High
British Pound Forecast: GBP/USD Stages Three Day Rally
Gold Price Rallies to Fresh Monthly High
--- Written by David Song, Senior Strategist
Follow on Twitter at @DavidJSong