
US Dollar Talking Points:
- The U.S. Dollar continues to pull back after showing overbought conditions on the daily chart last week.
- EUR/USD has bounced from range support and the question remains as to whether sellers will hold lower-high resistance to make a run at 1.0500. Meanwhile, Gold continues to pullback after flashing extreme overbought conditions on the weekly chart, and stocks have put in a bounce after an aggressive push from bears last week.
- This is an archived webinar that takes place every Tuesday. It’s free for all to register: Click here to register.
The U.S. Dollar
The U.S. Dollar continues to pull back from the prior gap that came in as resistance last week. At the time, RSI on the daily chart had flared into overbought territory, and this isn’t a very common occurrence as the last instance of such showed just before the currency had topped in Q4 of last year.
The question now is whether bulls show up to hold higher-low support. Prior resistance is now potential support at 104.77-105.00, and that remains an area of interest, but there’s also a couple of confluent Fibonacci levels between 105.38 and 105.51 that remains of interest; and if bulls show up there to hold the higher-low, that would be a more aggressive showing than if they allowed it to pull all the way back to around the 105.00 level.
U.S. Dollar Daily Price Chart
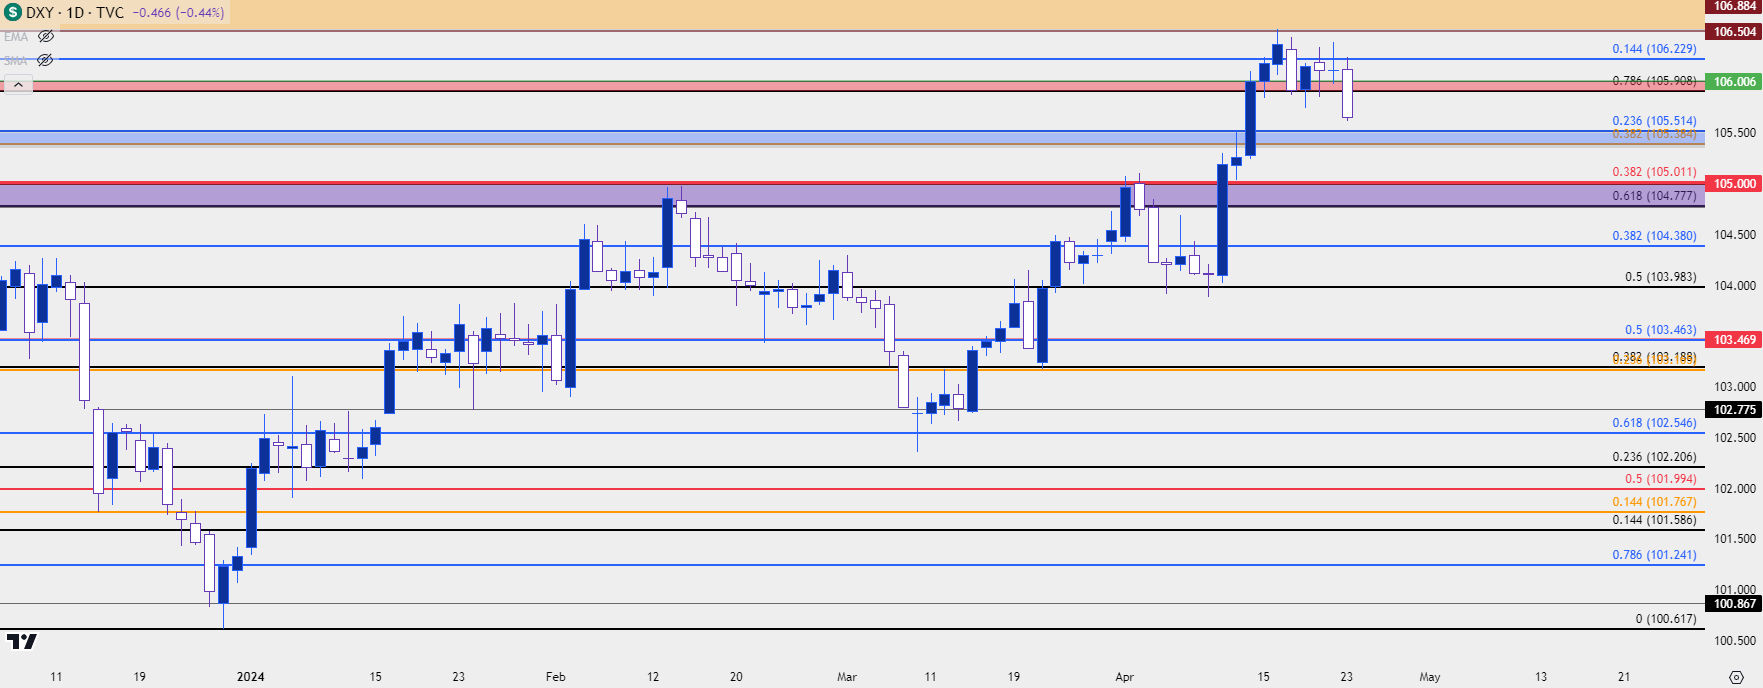 Chart prepared by James Stanley; data derived from Tradingview
EUR/USD
As USD flashed overbought conditions last week, EUR/USD went oversold on the daily chart. I had similarly highlighted this in last week’s webinar as that oversold RSI read also came along with a support test at a key spot on the chart, around the 1.0600 handle that’s been in-play a few times already. And near that is 1.0611, which is a key Fibonacci level, related to the same prices that helped to set the high in 2023 trade and resistance in March, before bears took control of near-term price.
Last week saw continued grind near the lows but there was a higher-low on Friday, right at that 1.0611 level and since then bulls have been forcing a stronger pullback. The question now is whether sellers re-enter to defend lower-highs, and there’s a few spots where that could take place. The 1.0725 level is now nearby, and that remains of interest. Just a bit higher is another zone around the 1.0750 psychological level, after which 1.0796 comes into play. And above that is the 200-day moving average which, notably, hasn’t been re-tested for resistance since the earlier-month breakdown in the pair.
EUR/USD Daily Price Chart
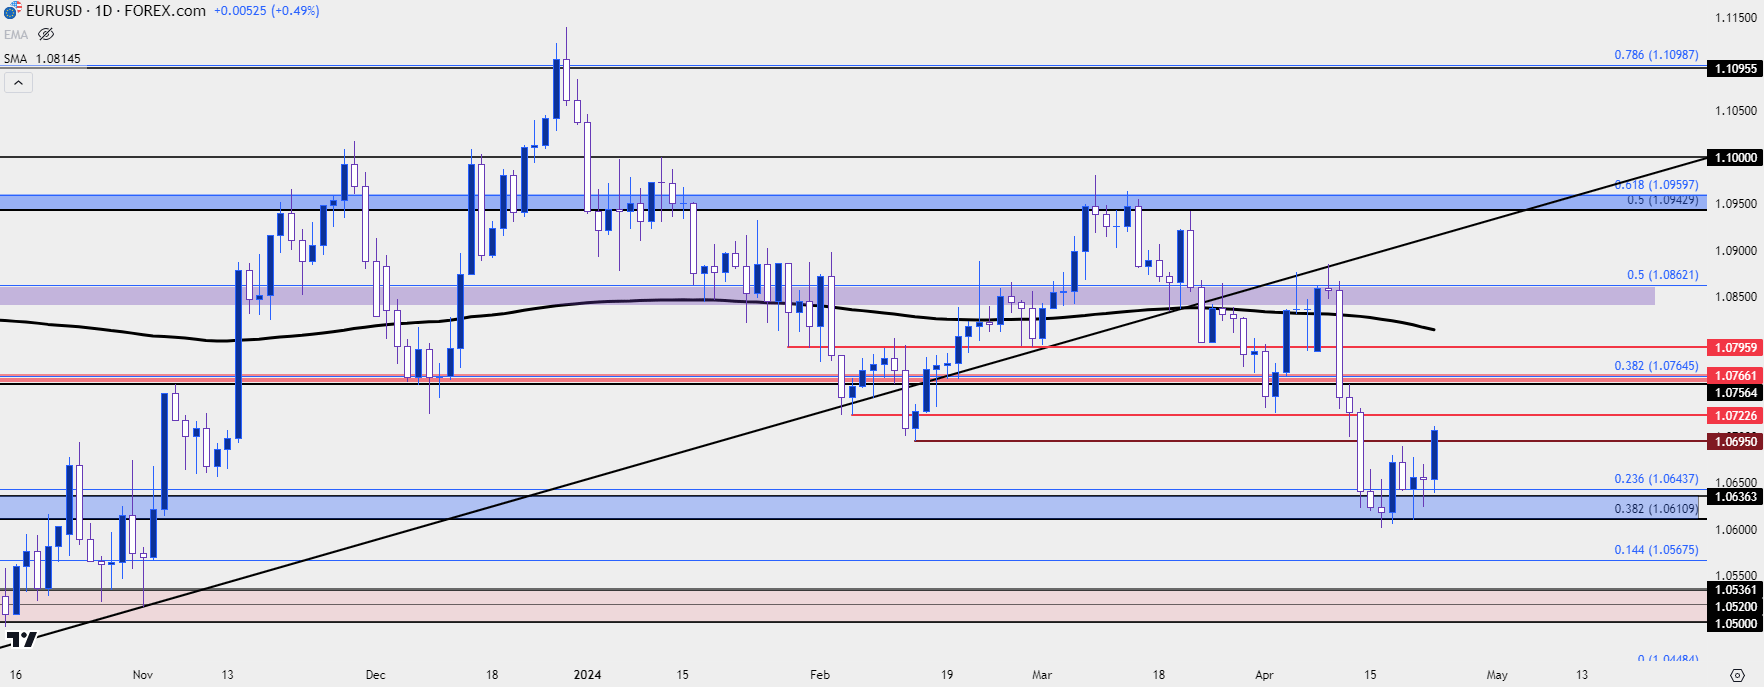 Chart prepared by James Stanley, EUR/USD on Tradingview

USD/JPY
USD/JPY continues to tip-toe up to the 155.00 level and we’ve already heard intervention threats from the Japanese Finance Ministry.
This sets the table for the BoJ rate decision later this week, scheduled for Friday morning in Asia/Thursday night in the U.S., and the big question there is whether the Bank of Japan will highlight any expected changes on the horizon.
The fear of intervention is that it may not work – because if the fundamental deviation between U.S. and Japanese rates doesn’t narrow, then there’s continued motive for bulls to drive the pair higher based on positive carry. What could whittle away at that argument is a rush of USD-weakness, such as we saw during pullbacks in Q4 of 2022 and 2023; but that’s not the case that we have right now as we’ve been seeing U.S. rate cuts get priced-out as the USD has remained strong.
So, the big question for this week is whether the BoJ makes any changes in effort of unsettling this dynamic and highlighting rate hikes on the horizon could certainly produce an element of change in the mix.
If they don’t do this, however, the 160.00 level is vulnerable as that’s the next significant spot of possible resistance above current spot rates.
USD/JPY Daily Price Chart
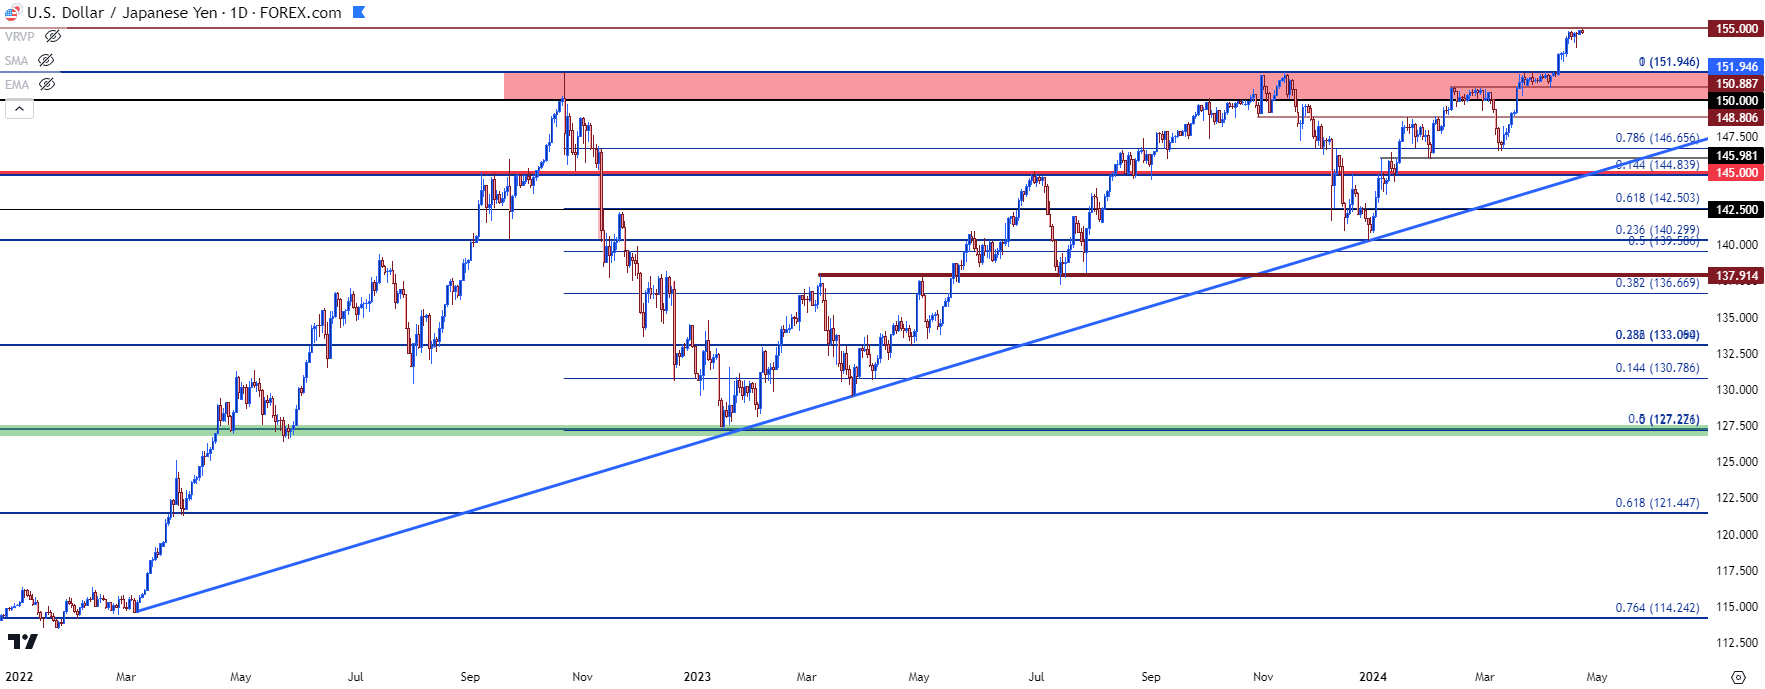 Chart prepared by James Stanley, USD/JPY on Tradingview
Gold
Gold made a loud entrance into April and Q2 trade, pushing up to another fresh all-time-high as there was both monetary drive as well as risk aversion flows emanating from continued conflict in the Middle East.
But, one-sided moves can lead to strong pullbacks, and that’s what we’ve seen of late in Gold. The big question here is whether Gold has topped and there’s already a few items suggesting as such. Last week’s bullish flare fell short of the prior weeks, leading to a lower-high. There’s also been an inability for bulls to hold the move above the $2,400 psychological level, indicating lacking acceptance above the big figure.
That led to a fast sell-off earlier today as prices tipped below the $2,300 level but that has since found support and that’s what I looked at in the webinar. The big question now is whether sellers use resistance at prior support to defend lower-highs, which could keep the door open for a deeper pullback scenario.
Sitting above current price is a prior swing at $2,333 that remains of interest, and then there’s the prior zone spanning from $2,350 up to $2,353. For next support, there’s a prior swing level at $2,265 and then another at $2,222-$2,228.
Gold (XAU/USD) Four-Hour Price Chart
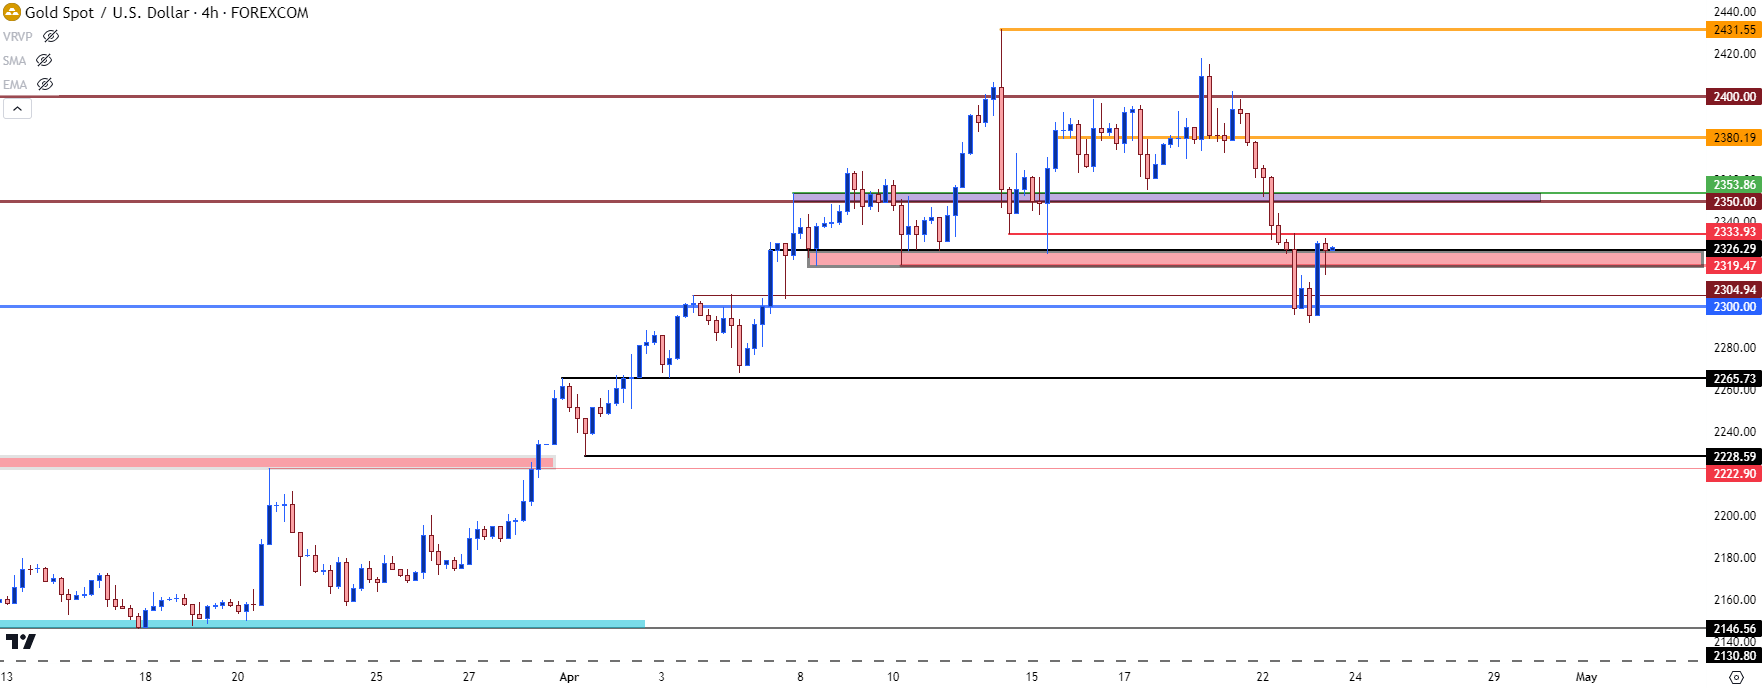 Chart prepared by James Stanley, Gold on Tradingview
USD/CAD Resistance Test Leads to Pullback
I looked into USD/CAD last week as price had pushed up to a significant spot of resistance, around the 1.3850-1.3900 zone. That resistance has helped to hold the highs for the past couple of years, but the pullback from that has moved in for a test at a big spot of 1.3652. That’s a Fibonacci level that’s had several inflections over the past year-and-change, and if bulls can hold support there, it could be a higher-low and that could produce one of the more attractive bullish USD scenarios in the current backdrop given both technical setup and fundamental backdrop.
USD/CAD Daily Price Chart
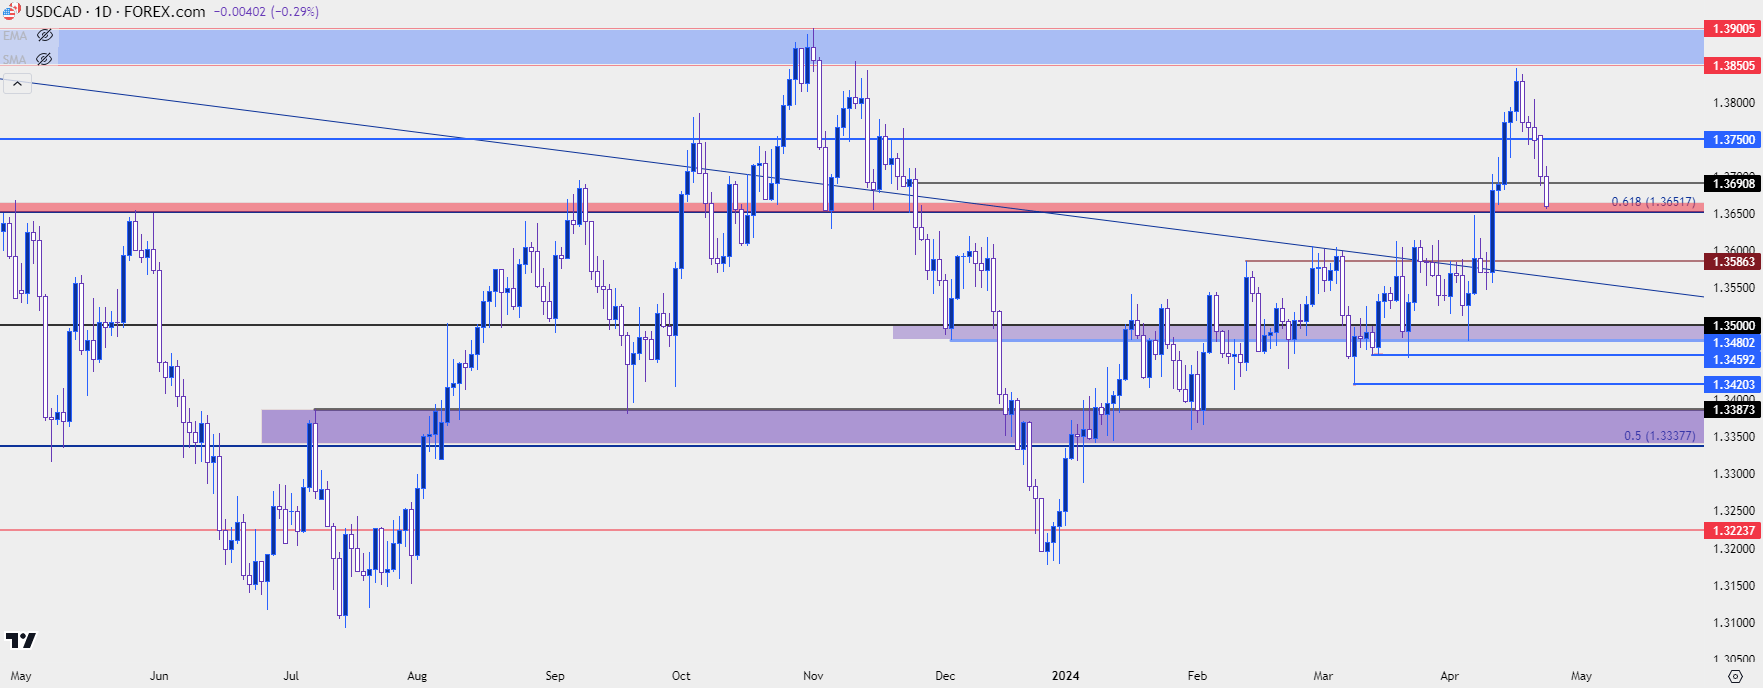 Chart prepared by James Stanley, USD/CAD on Tradingview
--- written by James Stanley, Senior Strategist