


The US Dollar has put in a fast pullback on the back of ceasefire hopes in Iran. It’s still early though, and there’s already reports that the ceasefire may not hold as highlighted by a couple of items early in the above video.
From a markets perspective the ceasefire announcement led to a scaling-back in some of the tension that’s shown and in FX markets, that’s the 160.00 level in USD/JPY. That price was tested around yesterday’s webinar but hopes then showed up that President Trump’s deadline may get pushed back. On the actual announcement later that night, several risk-on moves showed with gold breaking out, stocks continuing their rally and USD/JPY pulling back from the 160.00 handle.
The EUR/USD and GBP/USD setups looked at in yesterday’s webinar stretched with strong rallies.
In the DXY basket, we now have a test of a lower-low and there’s a big spot of support a little lower, around the 97.94 Fibonacci level that was ascending triangle resistance in February, ahead of the March breakout fueled by the conflict in Iran.
US Dollar Daily Price Chart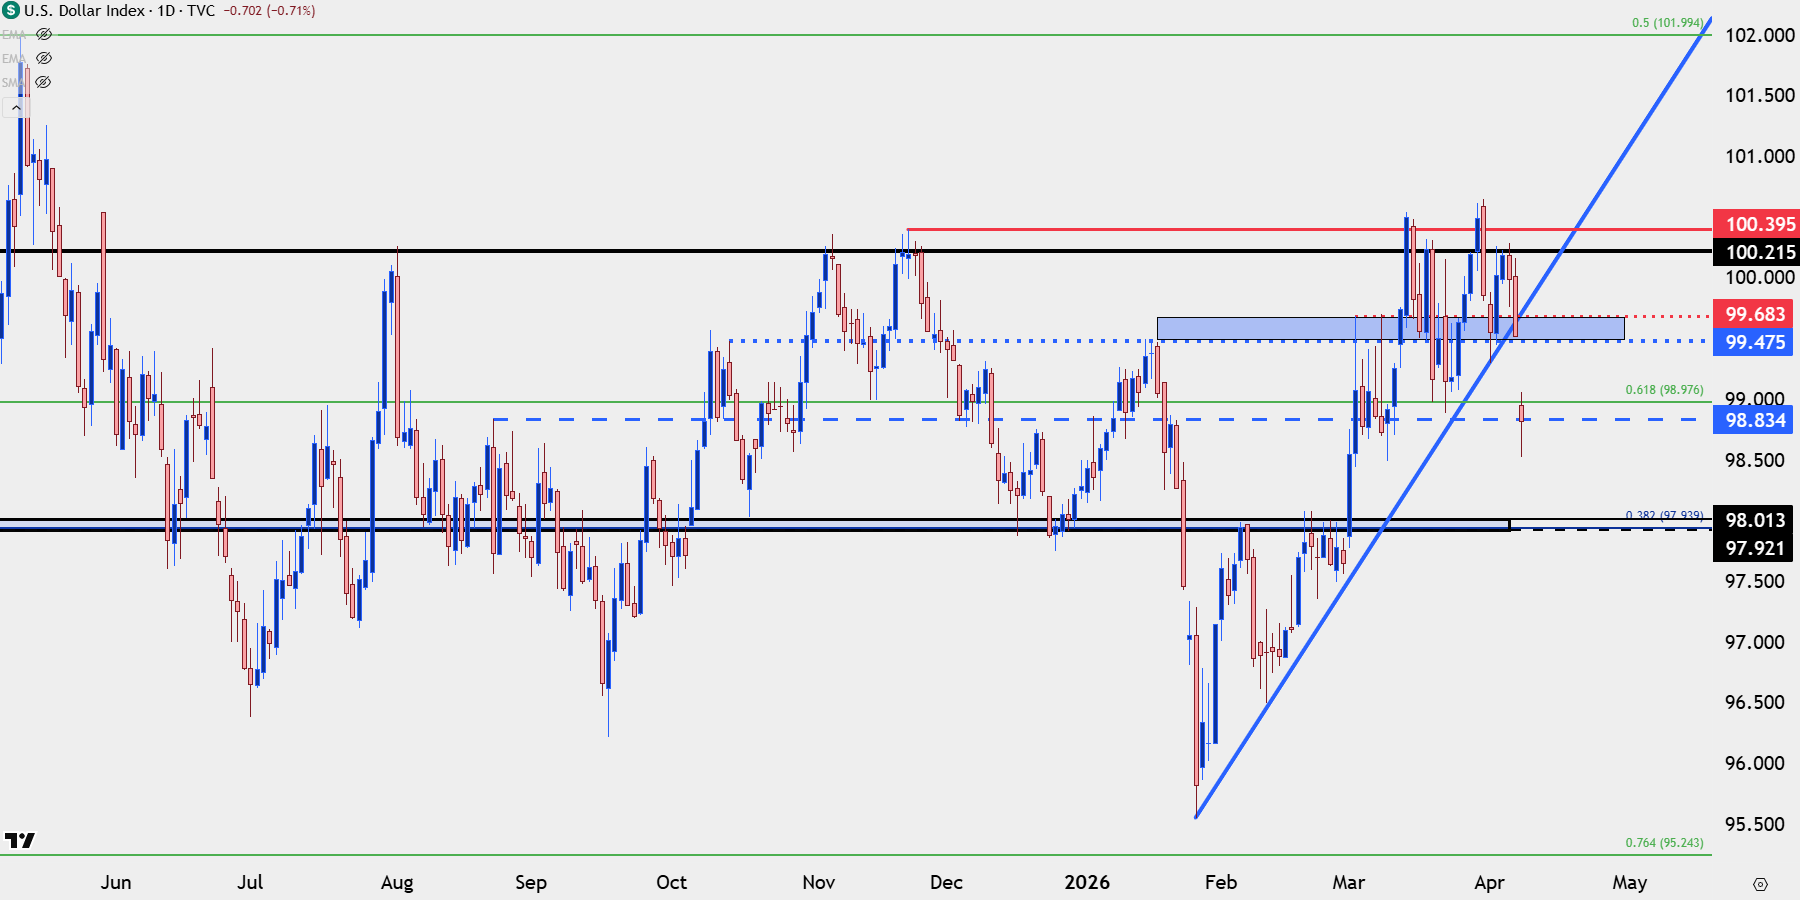
Chart prepared by James Stanley; data derived from Tradingview
USD/JPY
I remain of the mind that USD/JPY is the big push point for USD trends across the FX market, and the longer-term move in the pair illustrates why. The trade is still crowded and the rate divergence between the two economies still provides bullish motive.
Notably, it’s US CPI prints that drove reversals/pullbacks in 2022 and 2023, along with the bullish breakout in April of 2024, and we’re getting a very important US CPI print on Friday of this week.
If we do see continued tension in the Middle East, that’s a push on the long side of oil prices, which also pushes on higher inflation. This gives USD/JPY bulls a reason to push breakouts and the Bank of Japan is in the difficult spot of defending a line-in-the-sand that’s already started to give way.
With tensions easing on the back of ceasefire hopes we’ve seen the pair pullback, but there’s still bullish structure here as we have a test of support at prior resistance, taken from around 157.66-157.90.
USD/JPY Daily Price Chart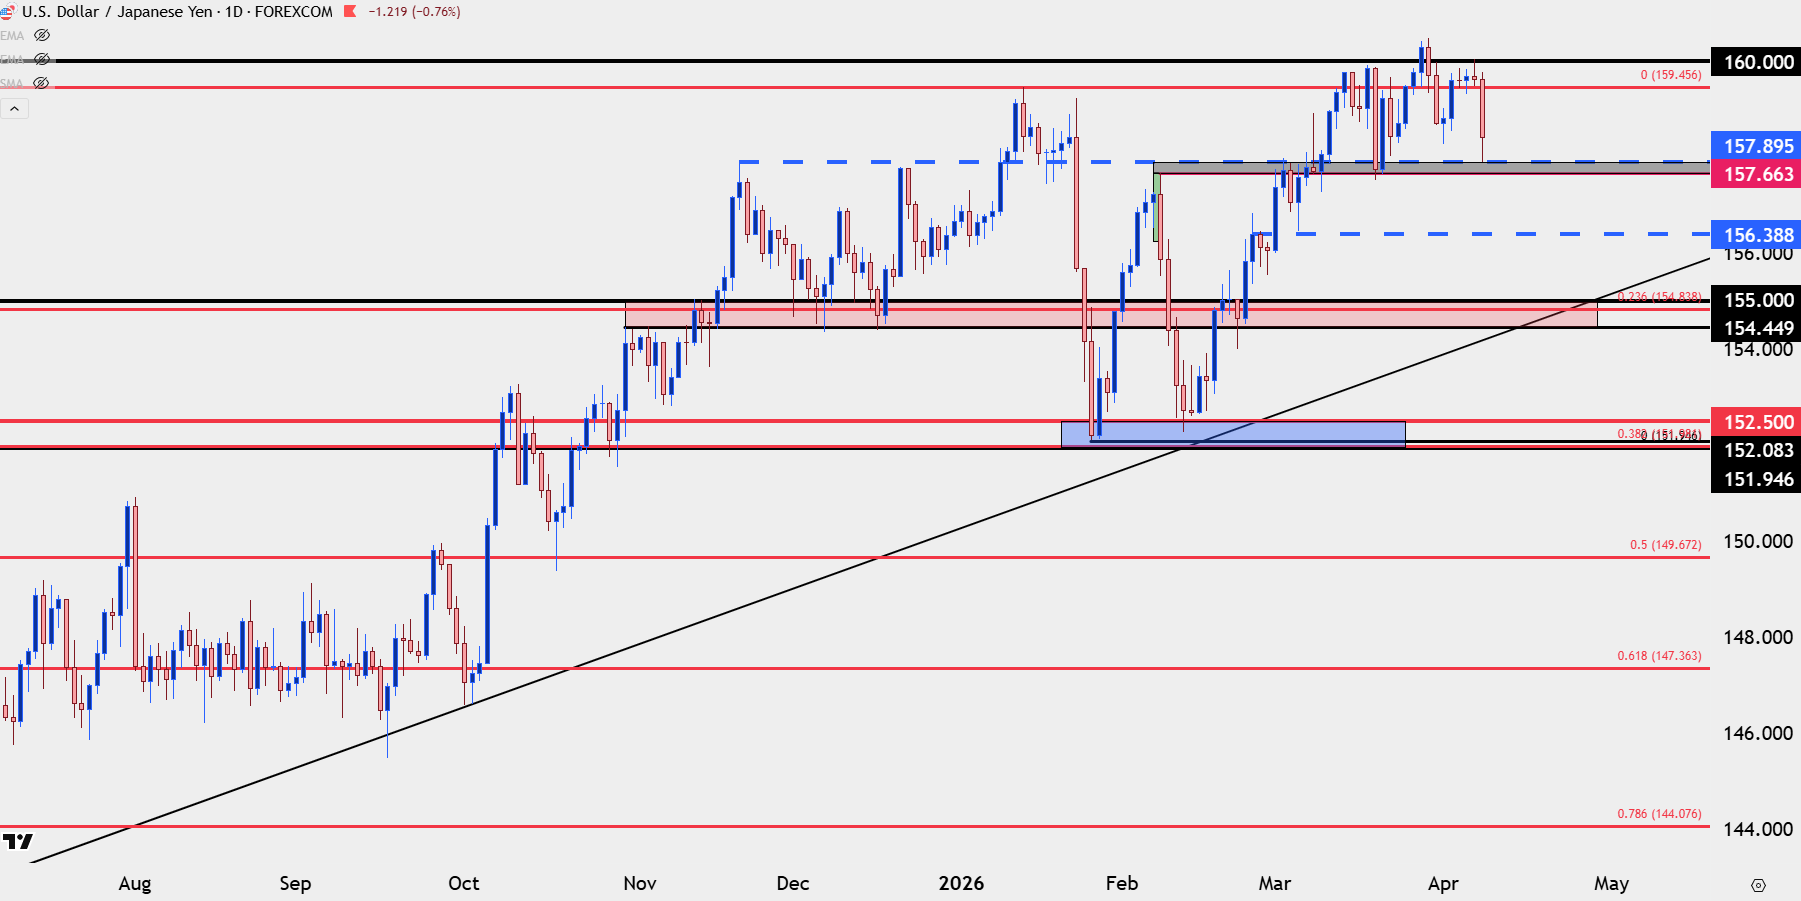
Chart prepared by James Stanley; data derived from Tradingview
EUR/USD Breakout
It’s the build of higher-lows over the past month that impressed in EUR/USD. The 1.1411 swing low was defended with a 1.1451 higher-low, and that spot held on a second test in late-March before a higher-low developed around the 1.1500 handle earlier this week.
That set the stage for last night’s breakout, and at this point there’s now bullish structure to work with on both the four-hour and daily charts.
Prior resistance is now support potential, spanning from 1.1628-1.1655. And next resistance is prior support from 1.1742-1.1766.
EUR/USD Four-Hour Price Chart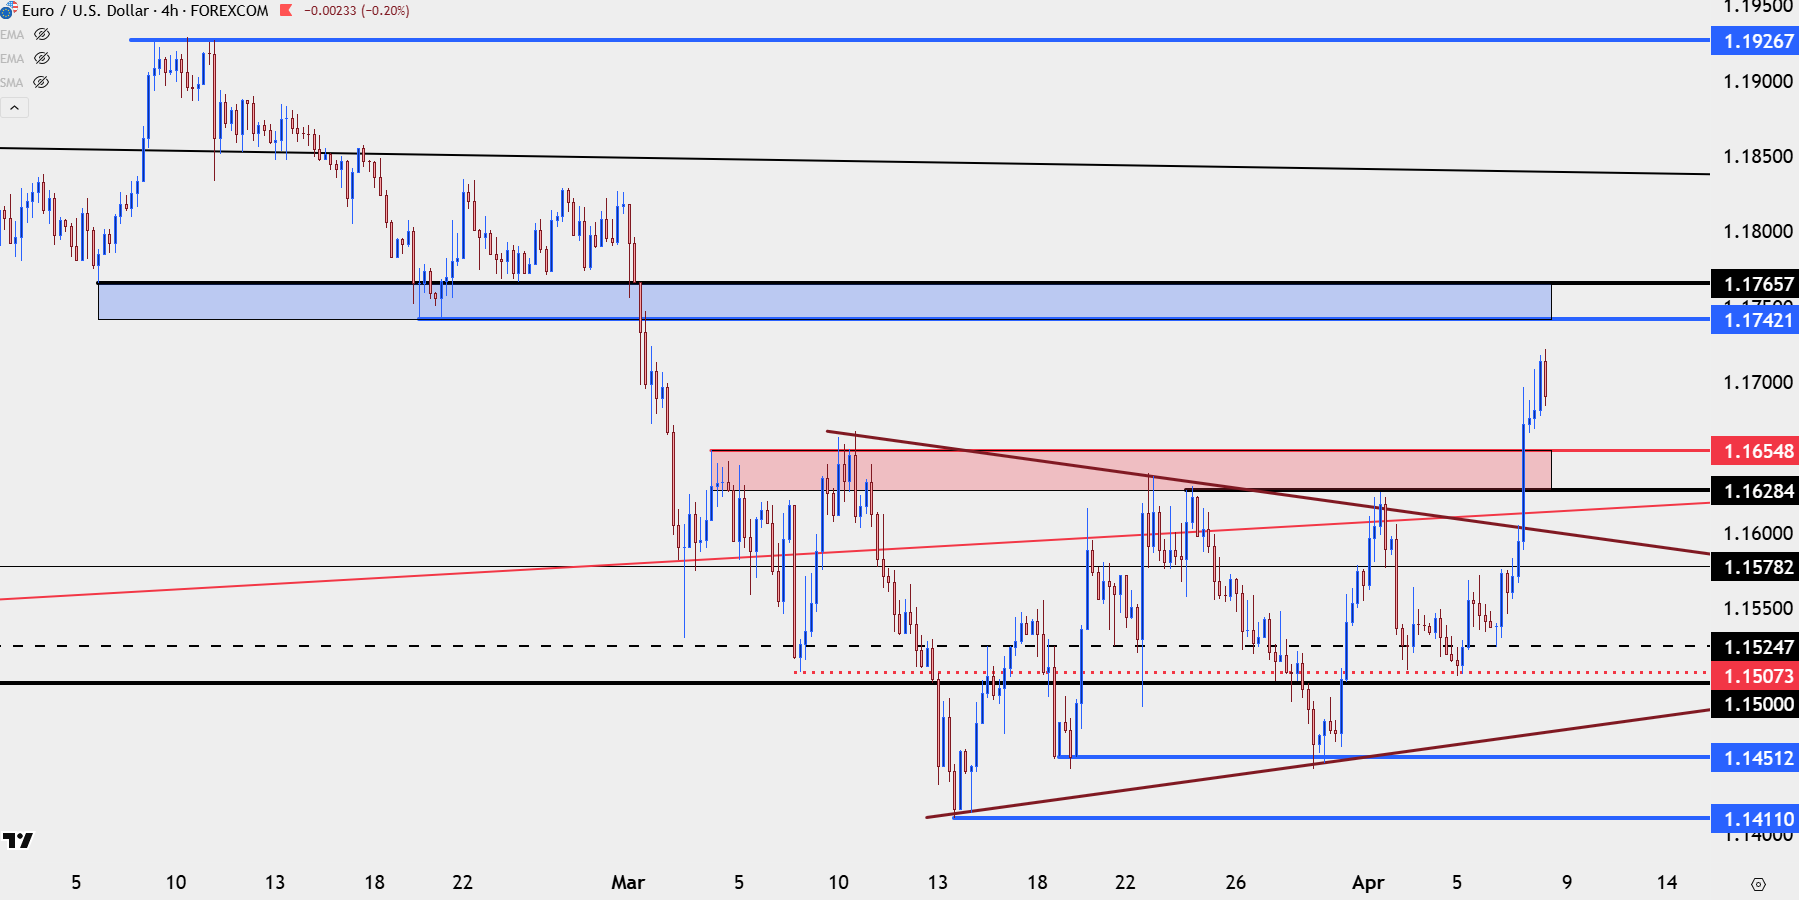
Chart prepared by James Stanley; data derived from Tradingview
EUR/GBP
While EUR/USD has shown more respectable bullish structure over the past month, EUR/GBP was indicating that change may be afoot, as the cross pair was testing a key zone of resistance at a Fibonacci level that I had looked at on Monday and Tuesday.
And with USD weakness coming in on the back of ceasefire hopes, both EUR/USD and GBP/USD have broken out, although the move in Cable has been approximately 25% larger than that in EUR/USD, as looked at in the above video.
This also shows in a resistance reaction in the cross-pair, as EUR/GBP has fallen from resistance and is now approaching a test of support at prior resistance.
EUR/GBP Daily Chart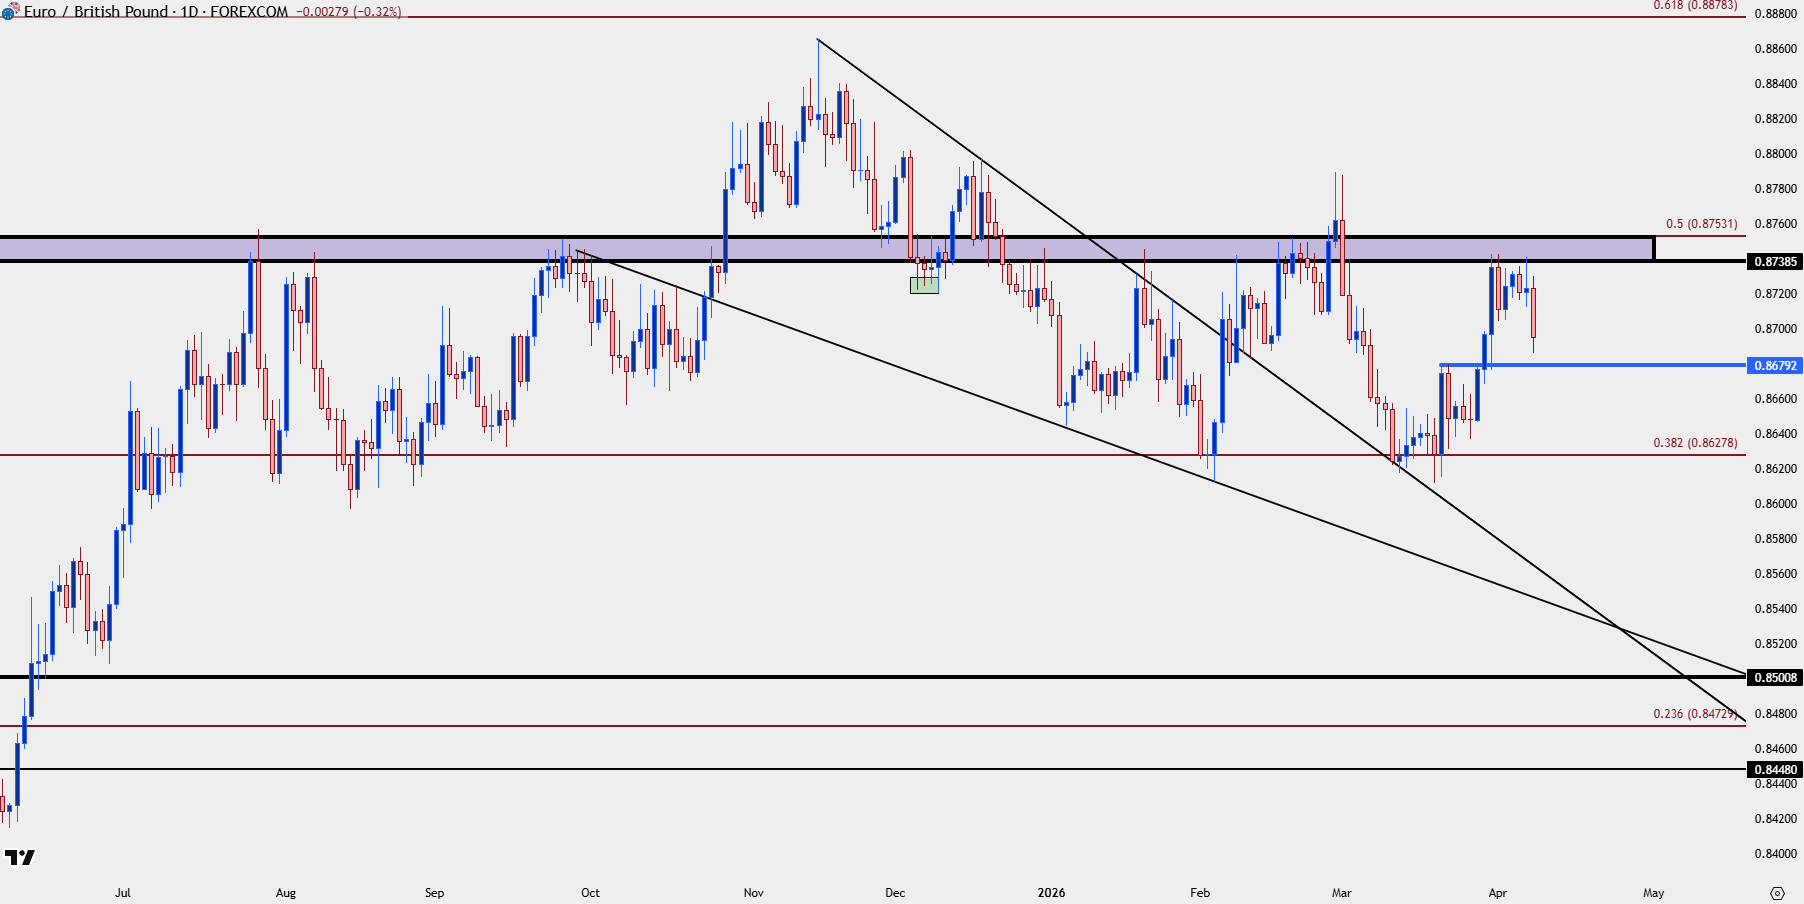
Chart prepared by James Stanley; data derived from Tradingview
GBP/USD
While EUR/USD has been working on higher lows over the past few weeks, GBP/USD has now. Even this week showed a re-test of support at the same level that was in-play previously and this was even as EUR/USD was setting up a higher-low at the 1.1500 level.
But, as USD-weakness has come on the jump in GBP/USD has been larger and from the daily chart, the falling wedge looked at in yesterday’s webinar has since led to a strong breakout in the pair, with price pushing up to prior resistance just inside of the 1.3500 handle.
At this point, there’s support potential at prior resistance, with the zone of 1.3414-1.3434 already close to coming back into play. Below that, there’s a swing level at 1.3373 and then a key zone from around 1.3250-1.3283.
GBP/USD Four-Hour Price Chart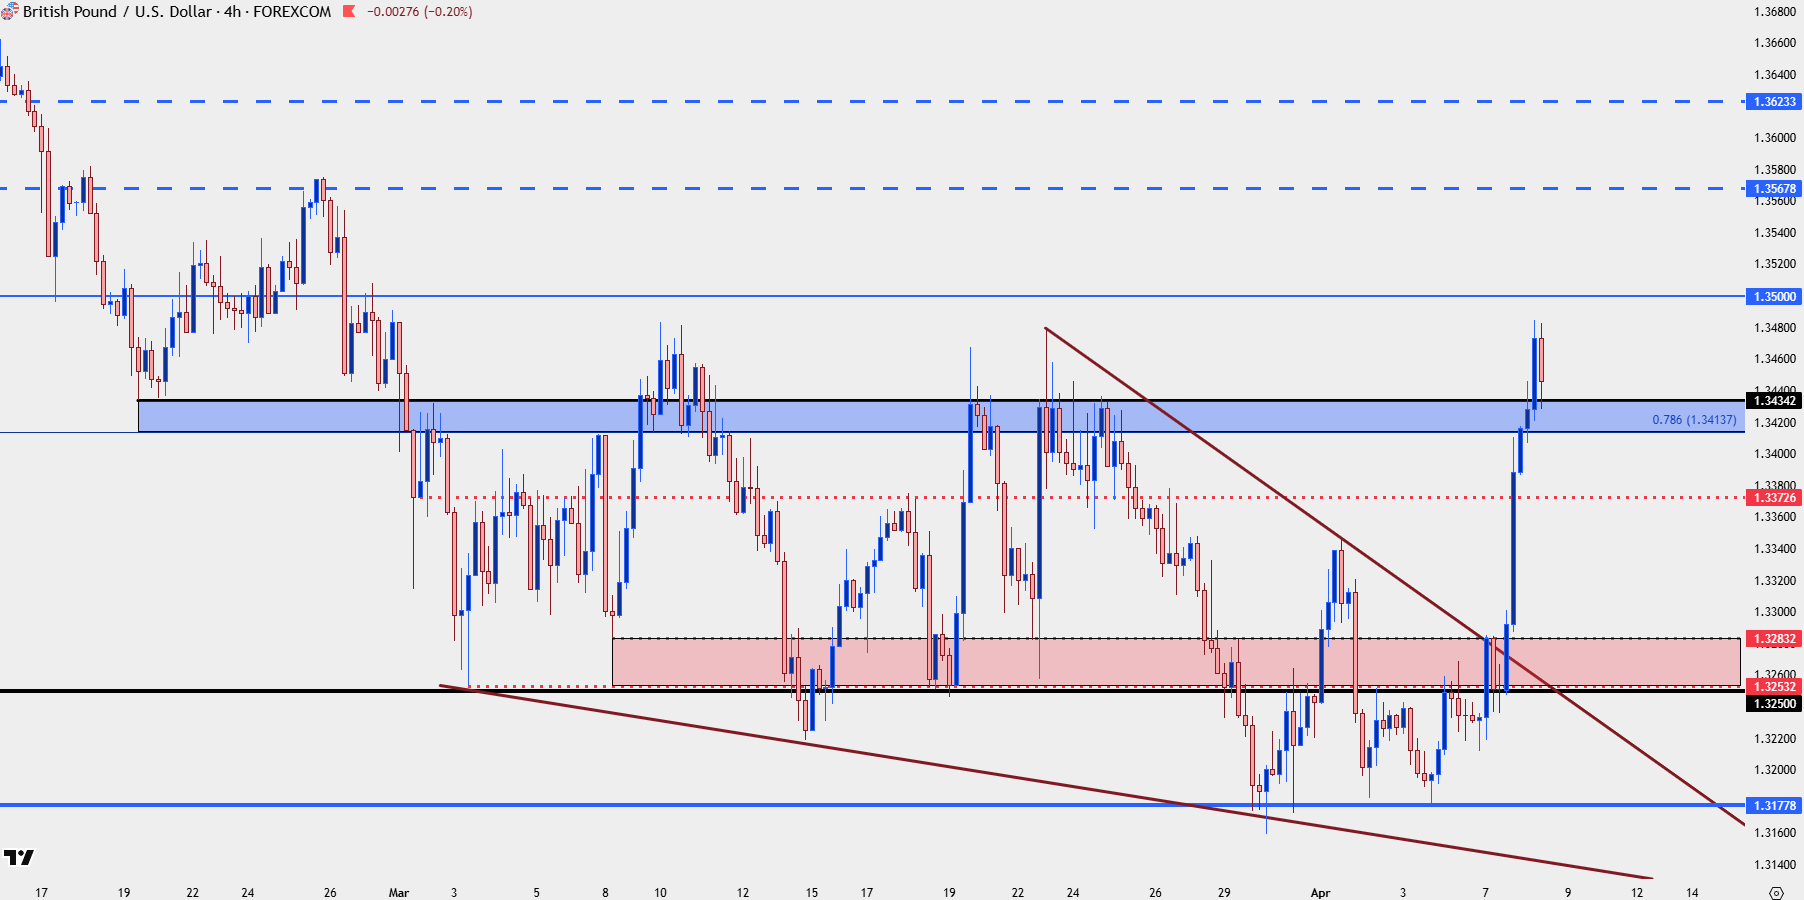
Chart prepared by James Stanley; data derived from Tradingview
--- written by James Stanley, Senior Market Analyst, Global Macro






