


Over the past three trading sessions, the USD/JPY pair has dropped more than 1.5%, signaling a renewed buying bias for the Japanese yen. The selling pressure in the pair reflects a consistent weakening of the US dollar. This new dynamic gained momentum following the announcement that Japan had reached a trade agreement with the United States, which has contributed to strengthening confidence in the yen. If this sentiment holds in the coming sessions, downward pressure on USD/JPY could intensify in the short term.

Has the Trade War Ended for Japan?
In the previous session, President Trump confirmed the signing of a major trade agreement with Japan, under which the Asian country has agreed to invest approximately 550 billion dollars in the United States. In exchange, Japanese exports to the US will be subject to a 15% tariff, lower than the 25% originally proposed by the US government weeks earlier.
Japanese Prime Minister Shigeru Ishiba welcomed the deal, stating that Japan had secured more favorable conditions than initially outlined. It was also clarified that Japan will not reduce tariffs on US goods, and both nations have agreed to uphold this measure in the short term.
This agreement marks a turning point in the ongoing trade conflict, positioning Japan as one of the first countries to secure a formal trade deal with the US, ending a prolonged period of negotiations. Although some tariffs remain, markets have interpreted the development as positive, helping reduce uncertainty surrounding Japan's economic outlook. Moreover, Japan avoids the high tariff levels imposed on other nations, a factor that has served as a key driver of demand for the yen in recent days.
Going forward, the implementation of this agreement will be critical. If confidence in the Japanese economy remains firm, we could see additional downward pressure on the USD/JPY pair in upcoming sessions.
What Happens Next with Interest Rates?
The trade agreement has eased some of the concerns that had been weighing on the Bank of Japan, and now there is growing speculation that the central bank may raise interest rates before year-end, surpassing the current level of 0.5%.
This sentiment is already being reflected in Japan’s 10-year bond yields, which have climbed to 1.6%, the highest level seen in 2025. This suggests that investors are demanding higher returns, potentially in anticipation of a more hawkish stance from the Bank of Japan in the months ahead. Recent 10-year bond auctions have also increased supply in the market, aiming to boost short-term investment flows into Japan.
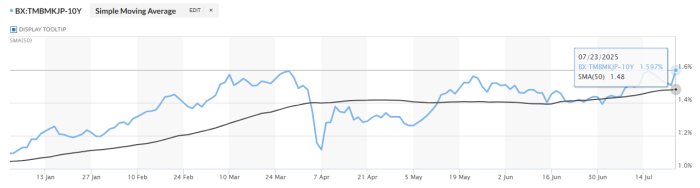
Source: MarketWatch
This environment could be crucial for reinforcing the yen’s strength. Higher yields on Japanese bonds may attract capital inflows, further supporting demand for yen. If this trend continues, bearish pressure on USD/JPY could extend into the short term.
USD/JPY Technical Outlook

Fuente: StoneX, Tradingview
- Sideways range holds: So far, USD/JPY price action has not been strong enough to break out of the broad sideways range between the resistance at 148.00 and the support at 141.89. Recent upward attempts have been rejected near the upper boundary, allowing a visible bearish correction to take shape on the chart. Nonetheless, the prevailing structure remains neutral, and without a decisive breakout on either side, lack of direction will likely continue to dominate.
- RSI: The Relative Strength Index continues to approach the neutral 50 level, indicating a sustained balance between buying and selling pressure. This configuration reinforces the chart’s technical neutrality. Unless the indicator clearly shifts, the current sideways channel could become even more relevant in the coming sessions.
- MACD: The MACD histogram remains near the zero line, reflecting an undefined technical scenario. Similar to RSI, this indicates a lack of dominant momentum, keeping the pair in a consolidation phase. Unless the histogram expands in either direction, neutrality will likely prevail.
Key Levels:
- 149.742 – Major Resistance: This level aligns with the 200-period simple moving average, making it a significant technical reference. A sustained breakout above this zone could confirm the start of a new bullish phase in USD/JPY and attract increased buying interest.
- 148.000 – Nearby Resistance: This marks the upper boundary of the current range and has been repeatedly respected by the price. If a breakout occurs in upcoming sessions, it could trigger a notable bullish bias, ending the recent consolidation period.
- 144.934 – Key Support: This level corresponds to the 50-period simple moving average. A break below this zone may open the door to further downside movement, increasing the likelihood of a broader bearish trend in the sessions ahead.
Written by Julian Pineda, CFA – Market Analyst
Follow him on: @julianpineda25






