
Key Events
- USDJPY holds above 150, yet remains capped by 153, limiting bullish continuation.
- USDCAD holds above 1.40, yet is challenged by 1.4080, keeping gains in check.
- DXY holds above 98, but struggles to break the 100 mark.
- The U.S. government shutdown keeps dollar pairs afloat amid missing economic releases.
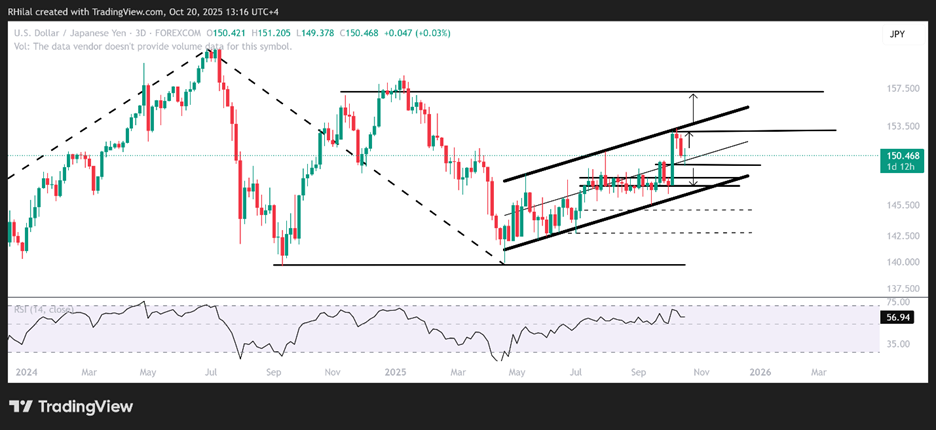
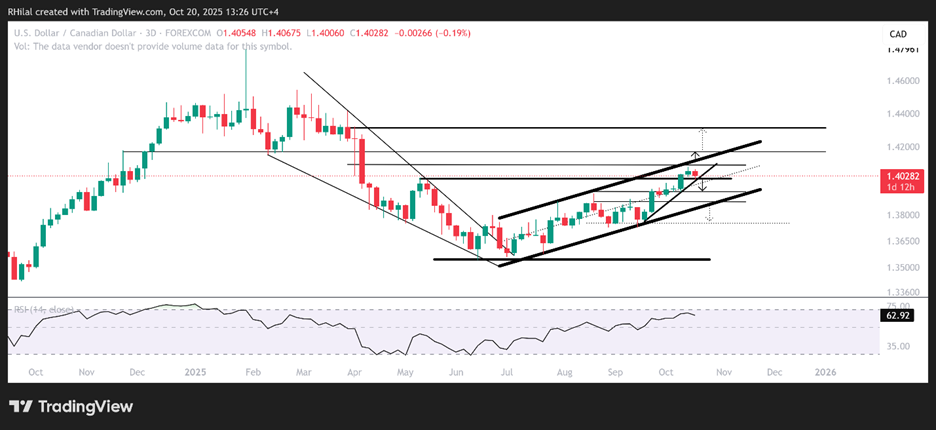
With CPI and payroll reports still missing this month — and no clear timeline for resolving the government shutdown — the U.S. Dollar Index (DXY) continues to trade above 98, but remains pressured below 100. Meanwhile, USDCAD is testing 1.4080 resistance, and USDJPY faces resistance at 153.30.
This setup reflects a similar rhythm across dollar pairs: a paused bullish rebound held back by key resistance zones and overbought daily momentum. The following scenarios highlight potential confirmations or reversals across both pairs.
The scenarios are technically defined below:
USDJPY Outlook: 3 Day Time Frame – Log Scale
Source: Tradingview
The USDJPY is currently trading above the mid-zone of a well-respected ascending channel that has been in place since the April 2025 lows, and below its upper boundary. Two critical confirmation levels define the near-term projection:
- Bullish Scenario:
- A sustained hold above 150 (the channel’s mid-zone) keeps the price aligned with the upper boundary near 153.30.
- A confirmed breakout above 153.30 would signal a continuation toward the 2025 highs near 157, and potentially higher — supported by a bullish rebound in the weekly RSI from oversold territory (as shown in the upcoming chart).
- Bearish Scenario:
- A close back below 150 would expose the pair to a deeper correction toward the channel’s lower boundary near 147.30, which also aligns with the 0.44 Fibonacci retracement of the rebound between April 2025 (139.88) and October 2025 (151.16).
- Should the lower boundary break, the bullish scenario would fade, with potential downside targets at 145.00 and 142.80.
USDCAD Outlook: 3-Day Time Frame – Log Scale
Source: Tradingview
Similar to USDJPY, the USDCAD is holding below the upper boundary of an ascending channel that extends from the June 2025 lows, while maintaining a position above key support at 1.4000 — a previous resistance level turned support.
The 1.4080 mark represents a critical resistance zone, aligning with:
- The upper channel boundary.
- The trendline connecting highs from July to August.
- The 0.44 Fibonacci retracement of the downtrend between January and July 2025.
With the bullish hold persisting amid limited economic data, the scenarios are:
- Bullish Scenario:
- A hold above the upper boundary and 1.41 mark would confirm a bullish continuation toward 1.4180 and 1.4300.
- Bearish Scenario:
- A failure to hold above 1.40 (the channel’s mid-zone) could extend the decline toward the lower boundary at 1.3880, offering potential support.
- A decisive break below that level would open the door to the next support near 1.3750.
Written by Razan Hilal, CMT
Follow on X: @Rh_waves