


ASX 200 Market Outlook: Risk-Off Deepens as Volatility Spikes
The ASX 200 slides for a fourth week as AI-driven risk-off sentiment intensifies, sector losses broaden and volatility hits a six-month high.
Share this:

The ASX 200 extended its decline for a fourth straight week as risk-off sentiment intensified across global markets. An AI-led selloff, rising volatility and fading expectations of an RBA cut weighed heavily on local shares, with defensive pockets also beginning to crack. Sector breadth weakened further, and correlations tightened across risk assets — underscoring the shift toward caution as the index trades near five-month lows.
View related analysis:
View related analysis:
ASX 200 Outlook: Risk-Off Momentum Builds
- Risk-off sentiment driven by the AI-led selloff and reduced odds of an RBA cut sent the ASX 200 lower for a fourth straight week.
- Information Technology (XIJ) and Materials (XMJ) led 10 of the 11 ASX 200 sectors lower. Consumer Staples (CSJ) was the only sector to edge higher — by just 0.04%, effectively flat.
- A bearish engulfing candle formed on Friday and implied volatility climbed to a six-month high.
- The ASX 200 is also on track for its worst month since February, currently down -5.2% and trading at a five-month low.
- Thursday’s volatility has been rising in recent weeks, with the three-month average now the second-highest of the week (78.6 points) and the one-year average the highest (80.5 points).
- Mondays have been the second-most volatile day over the past year (77.4 points), yet the least volatile over the past three months (66.5 points).

Chart analysis by Matt Simpson - source: ASX, LSEG


Chart analysis by Matt Simpson - source: ASX, LSEG
ASX 200 Correlations
- The positive correlation between the ASX 200 and its two most influential sectors — Financials and Materials — has strengthened as the broader market selloff has accelerated.
- General risk aversion has also seen the positive correlation return between AUD/USD and the ASX 200, along with major global indices including the Nasdaq 100, S&P 500, Dow Jones, Nikkei 225, FTSE 100 and DAX.
- It’s notable that the ASX 200 shows little correlation with gold, while the 3-year bond correlation remains low at 0.3.
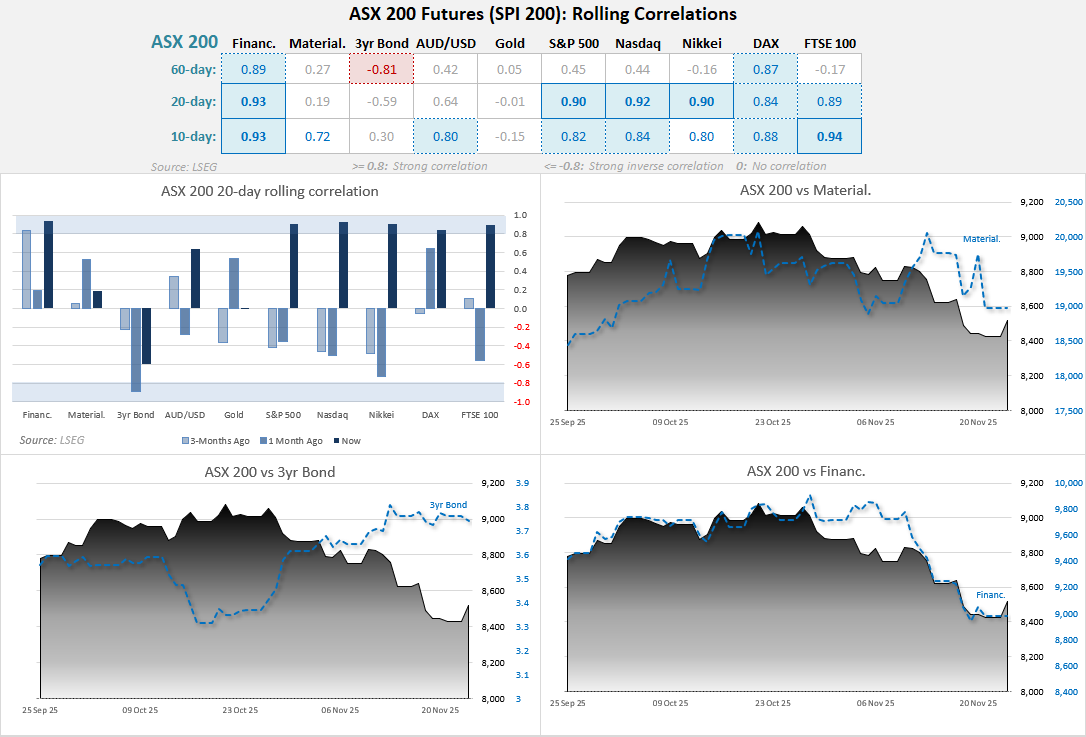
Chart analysis by Matt Simpson - source: ASX, LSEG
ASX 200 Sector Analysis
- While technology (XIJ) topped out way before the ASX and led the selloff lower, financials was not far behind. But to see materials turn lower from recent highs underscores how concerned investors are and screams risk off.
- Even the safety of utilities (XUJ) has been dented with the sector falling to a 12-week low on Friday.
- Energy (XEJ) suffered its worst day in nine weeks on Friday amid the risk-off tone and lower crude oil prices.
- Real estate (XRE) could be looking to break lower after Friday’s bearish candle slammed prices to its cycle lows of a small, bearish consolidation
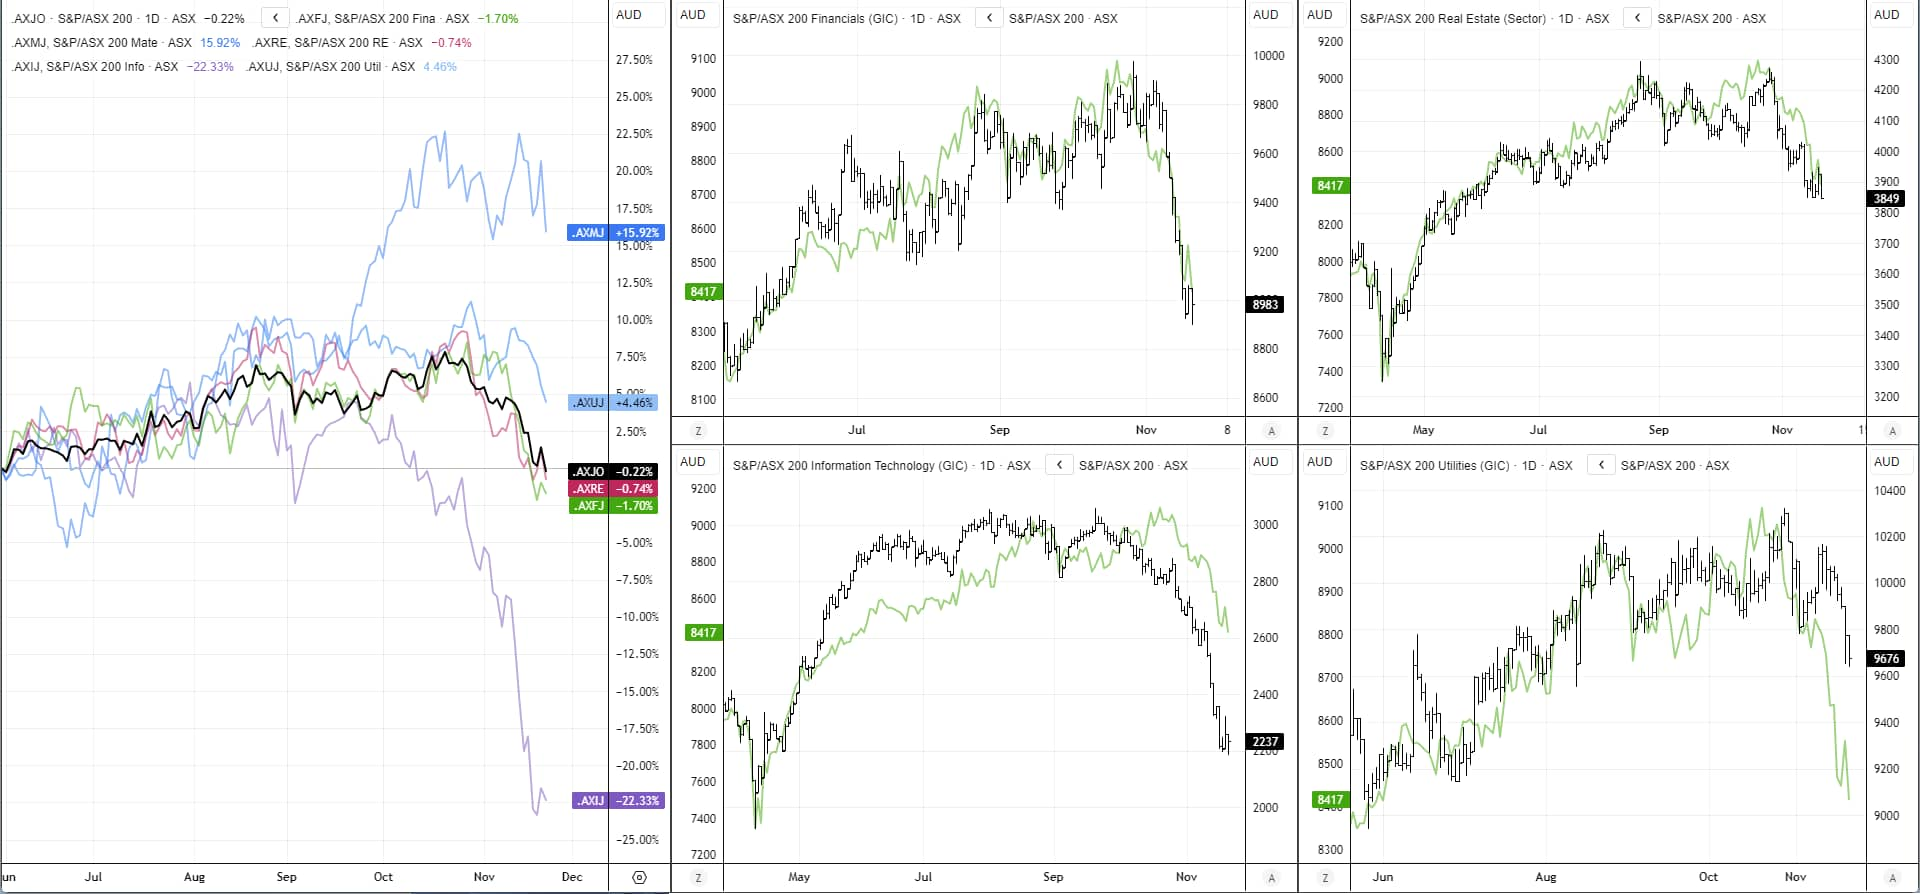
Chart analysis by Matt Simpson - source: ASX, LSEG


ASX 200 Futures (SPI 200) Technical Analysis
The fall from its record high has seen ASX futures drop around 8% over 26 trading sessions, breaking below both the 200-day SMA and 200-day EMA. Prices are attempting to stabilise after Friday’s low, with the ASX respecting the long-term 38.2% Fibonacci retracement around 8400.
While the daily RSI (14) reached oversold last week, there is still no bullish divergence forming — which leaves room for further downside.
With sentiment firmly negative and key ASX sectors under pressure, bears may look to fade rallies in anticipation of a break below 8400 and a move toward 8200 near the 50% retracement level.

Chart analysis by Matt Simpson - Source: TradingView, ASX SPI 200 Index Futures
View the full economic calendar
View the full economic calendar
-- Written by Matt Simpson
Follow Matt on Twitter @cLeverEdge
How to trade with City Index
You can trade with City Index by following these four easy steps:
- Open an account, or log in if you’re already a customer
• Open an account in the UK
• Open an account in Australia
• Open an account in Singapore
- Search for the market you want to trade in our award-winning platform
- Choose your position and size, and your stop and limit levels
- Place the trade
Latest market news




The complete CFD trading experience
Award-winning platforms, competitive spreads, low commissions and dedicated support.
We live and breathe the markets and are dedicated to helping traders realise their ambitions as we continue to set the industry bar.
Economic calendar
Web Trader platform
Our sophisticated web-based platform is packed with features.
Related articles
Nasdaq volatility shock warns against buying too early
An extraordinary sell-off has left Nasdaq 100 futures deeply oversold, but history suggests further downside is common before a sustained recovery takes hold.
S&P 500 Update: SPX Records Its Biggest Selloff of the Year Ahead of NFP
The trading week has not been particularly favorable for risk appetite in the short term, and this is now becoming increasingly evident in the performance of the S&P 500. During today's session, the index is down nearly 4.2%, marking its largest intraday decline of 2026.

Canadian Dollar Short-term Outlook: USD/CAD Plunge Stalls at Pivotal Support—Range Break in Focus 11 5 2026
Friday’s U.S. and Canadian employment reports could trigger a decisive USD/CAD move as bulls and bears battle for control at critical support.

StoneX Europe Ltd may make third party material available on this website which may contain information included but not limited to the conditions of financial markets. The material is for information purposes only and does not contain, and should not be construed as containing, investment advice and/or investment recommendation and/or an investment research and/or an offer of or solicitation for any transactions in financial instruments; any decision to enter into a specific transaction shall be made by the client following an assessment by him/her of their situation.
StoneX Europe Ltd makes no representation or warranty and assumes no liability as to the accuracy or completeness of the information provided, nor any loss arising from any investment based on a recommendation, forecast or other information supplied. You should always seek independent advice as to your suitability to speculate in any related markets and your ability to assume the associated risks, if you are at all unsure. We are not under any obligation to update any such material. Any opinion made may be personal to the author and may not reflect the opinion of StoneX Europe Ltd.