


ASX 200 Morning Outlook: Bulls Seek Support After Second Weekly Decline
The ASX 200 suffered its worst two-week fall in seven months, led by losses in Tech, Materials, and Consumer stocks, as traders eye key support levels.
Share this:
The ASX 200 fell for a second consecutive week — its worst two-week stretch in seven months — as risk-off sentiment weighed on equities. Heavy losses in Materials, Information Technology, and Consumer Discretionary dragged the index lower, though some traders are watching for a potential stabilisation at key support levels. Declining volume and modest strength in Energy hint that selling momentum may be starting to fade.
View related analysis:
- Australian Dollar Outlook: RBA Hold Puts Focus on AU Jobs, US CPI
- ASX 200 Morning Market Outlook: Sectors Highlight Structural Weakness
- ASX 200 Morning Market Outlook: Bearish Reversal Pattern For October
- ASX 200 Morning Outlook: Buyers Test Support as BHP and WOW Stabilise
- ASX 200 Morning Outlook: Commodities Bounce Helps Materials Lead Gains
View related analysis:
- Australian Dollar Outlook: RBA Hold Puts Focus on AU Jobs, US CPI
- ASX 200 Morning Market Outlook: Sectors Highlight Structural Weakness
- ASX 200 Morning Market Outlook: Bearish Reversal Pattern For October
- ASX 200 Morning Outlook: Buyers Test Support as BHP and WOW Stabilise
- ASX 200 Morning Outlook: Commodities Bounce Helps Materials Lead Gains
ASX 200 Market Snapshot
- The ASX 200 fell for a second consecutive week, with its -2.7% decline marking the worst two-week stretch in seven months.
- A clear risk-off tone dominated the market, led by losses in Information Technology (XIJ), Materials (XMJ), and Consumer Discretionary (XDJ) — three of the weakest-performing sectors as eight of eleven finished lower.
- The index is now effectively flat over the past three months, with mega-cap stocks providing most of the support. The ASX 200 continues to outperform the broader All Ordinaries, which typically reflects a defensive market bias — stronger small-cap participation would normally indicate healthier sentiment.
- The Energy sector (XEJ) managed a 1% gain despite lower crude oil prices. While the overall price structure remains bearish, it’s worth noting that selling volume has declined for three straight weeks and has stayed below average for five, suggesting reduced conviction behind recent weakness.
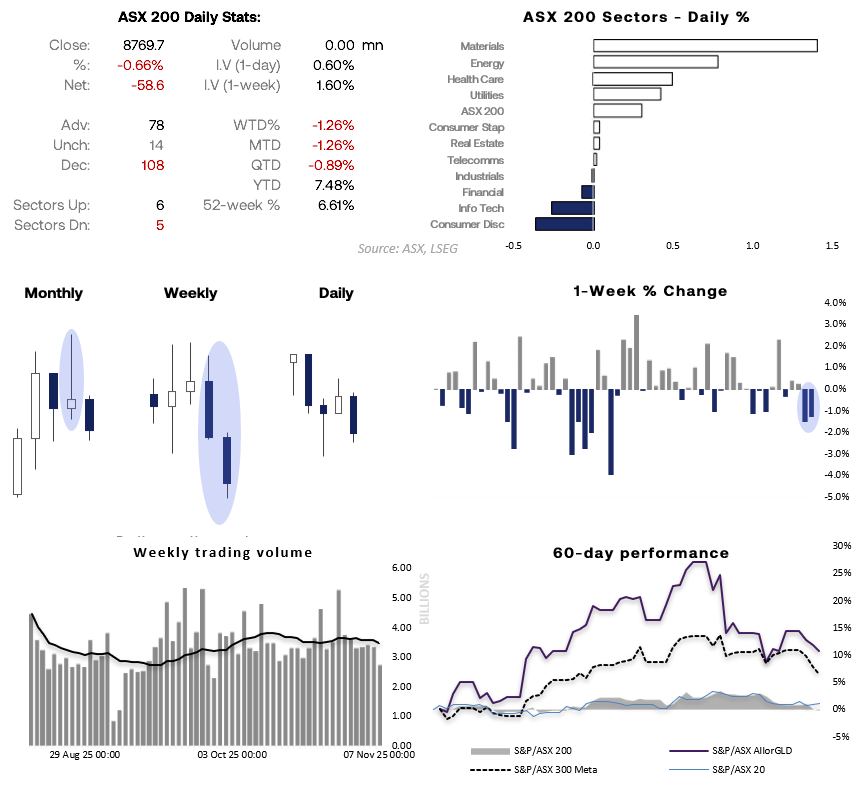
Chart analysis by Matt Simpson - source: ASX, LSEG
ASX 200 Correlations
- The positive correlation between the ASX 200 and Wall Street has returned to positive territory over the past ten days
- Financial stocks have lagged the broader index, showing limited alignment with overall market movements.
- In contrast, the Materials sector maintains a strong positive correlation with the ASX 200 across both the 10-day and 20-day periods
- There is also a weak inverse correlation between the Australian 2-year yield and the ASX 200 over the past ten days, which strengthens over the 20-day timeframe
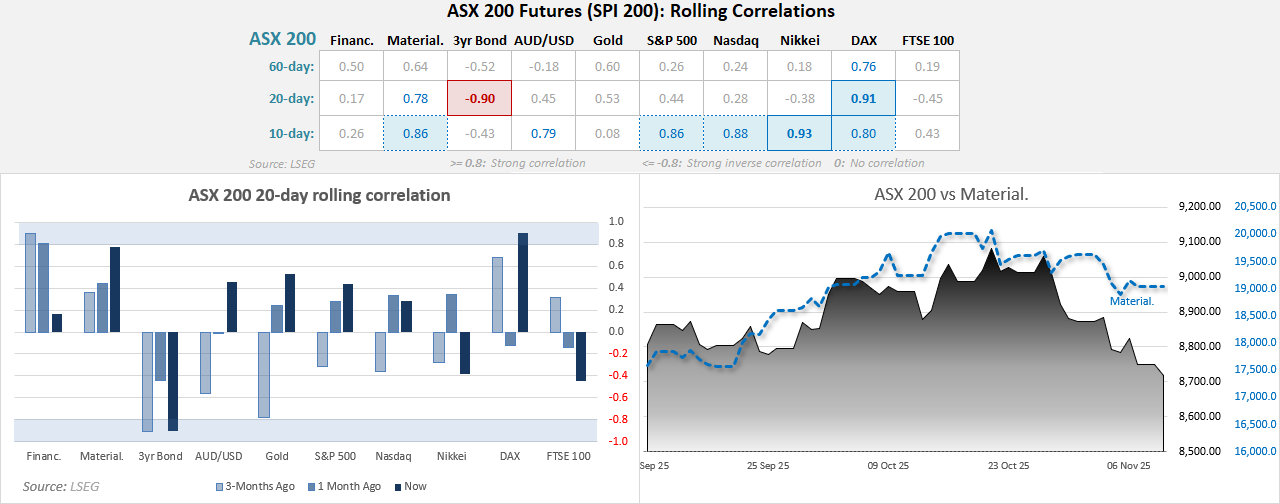
Chart analysis by Matt Simpson - source: ASX, LSEG


ASX 200 Technical Analysis
An interesting observation on the ASX 200 futures chart is that weekly trading volume increased last week, returning to its 20-week average. This contrasts with the lower volume seen in the ASX cash market, suggesting that most trading activity has occurred during the overnight futures session.
Friday night saw a mild attempt to break below the September low, near Tuesday’s spinning top doji. A bullish divergence has formed on the daily RSI (2), hinting that the market may be preparing for a short-term bounce. However, traders should allow for some wriggle room around Friday’s low and wait to see if prices gap lower before assuming a rebound is underway.
The September VPOC (8,852) and 0.8862 swing low are potential upside targets for bulls, while a break above these levels could bring the 8,900–8,950 zone into focus. Still, given the bearish signals on the weekly chart, the broader bias remains to look for evidence of a lower high in anticipation of another leg lower in the ASX 200.

Chart analysis by Matt Simpson - Source: TradingView, ASX SPI 200 Index Futures
View the full economic calendar
View the full economic calendar
-- Written by Matt Simpson
Follow Matt on Twitter @cLeverEdge
How to trade with City Index
You can trade with City Index by following these four easy steps:
- Open an account, or log in if you’re already a customer
• Open an account in the UK
• Open an account in Australia
• Open an account in Singapore
- Search for the market you want to trade in our award-winning platform
- Choose your position and size, and your stop and limit levels
- Place the trade
Related tags:

The complete CFD trading experience
Award-winning platforms, competitive spreads, low commissions and dedicated support.
We live and breathe the markets and are dedicated to helping traders realise their ambitions as we continue to set the industry bar.
Economic calendar
Web Trader platform
Our sophisticated web-based platform is packed with features.
Related articles
Forex & Gold Outlook: Dollar Dominates, Crosses Diverge
The US dollar rally gathers momentum as forex crosses develop contrasting technical setups. Matt Simpson examines eight FX markets and gold for potential trading opportunities.

Gold Outlook: Asia Buys the Dip, US Hammers the Rip
Asia buys the dip, the US sells the rip. Hourly gold, dollar and Treasury yield data reveal a regional divide that has become especially pronounced since September.


AUD/USD Bears Tighten Their Grip Into AU Jobs, RBA Minutes
AUD/USD falls below 68 cents as US dollar strength and peak RBA rate expectations put Australian jobs data and RBA minutes in focus.
StoneX Europe Ltd may make third party material available on this website which may contain information included but not limited to the conditions of financial markets. The material is for information purposes only and does not contain, and should not be construed as containing, investment advice and/or investment recommendation and/or an investment research and/or an offer of or solicitation for any transactions in financial instruments; any decision to enter into a specific transaction shall be made by the client following an assessment by him/her of their situation.
StoneX Europe Ltd makes no representation or warranty and assumes no liability as to the accuracy or completeness of the information provided, nor any loss arising from any investment based on a recommendation, forecast or other information supplied. You should always seek independent advice as to your suitability to speculate in any related markets and your ability to assume the associated risks, if you are at all unsure. We are not under any obligation to update any such material. Any opinion made may be personal to the author and may not reflect the opinion of StoneX Europe Ltd.