







The ASX 200 tries to lull bears into its trap while S&P 500, Nasdaq 100 tease new highs
While the ASX shows the potential to dip further, I remain wary that we’ll see an immediate bearish follow through while Wall Street teases new record highs.
Share this:

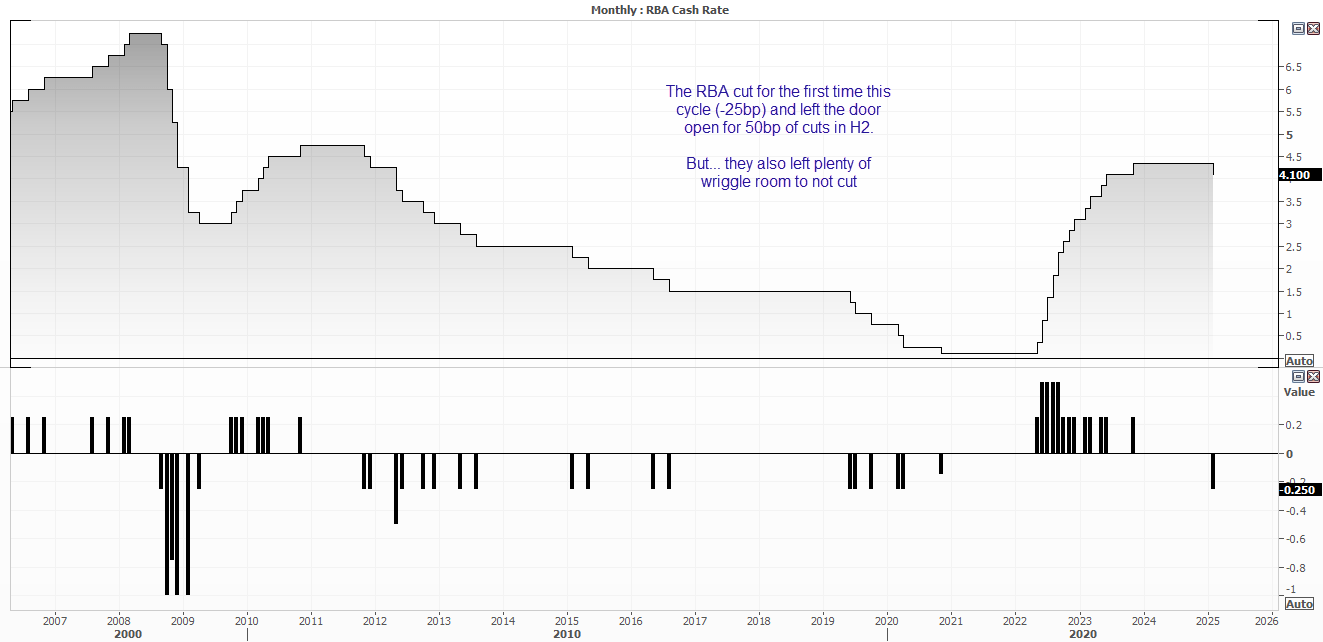
You more than likely heard that the RBA cut their cash rate by 25bp yesterday. It is interesting hearing how divided over whether it was a hawkish or dovish cut. I’m more centrist on this one with a tilt to dovish; it was not as dovish as many hoped (and as I repeatedly warned), they have no appetite to hike, they have left the door open for two cuts in the second half of the year. However, they have left plenty of wriggle room to close the door on cuts if inflation returns. To see my rationale, you can view my RBA instant view.
I doubt today’s wage price index will tell us anything new, and it tends not to be much of a market mover anyway.
Canada’s inflation data came in higher than expected, thanks to a rise in gasoline, natural gas and passenger vehicle prices. Odds of a BOC cut in March have now been reduced to 37%, which strengthens the case for USD/CAD to head for 1.40. And unless we se a material bounce on the US dollar, USD/CAD may struggle to bounce to 1.4250 – 1.430 first, as outlined in yesterday’s near-term bias.
View related analysis:
- USD/CAD holds support heading into CPI, but 1.40 remains achievable
- USD/CAD holds support heading into CPI, but 1.40 remains achievable
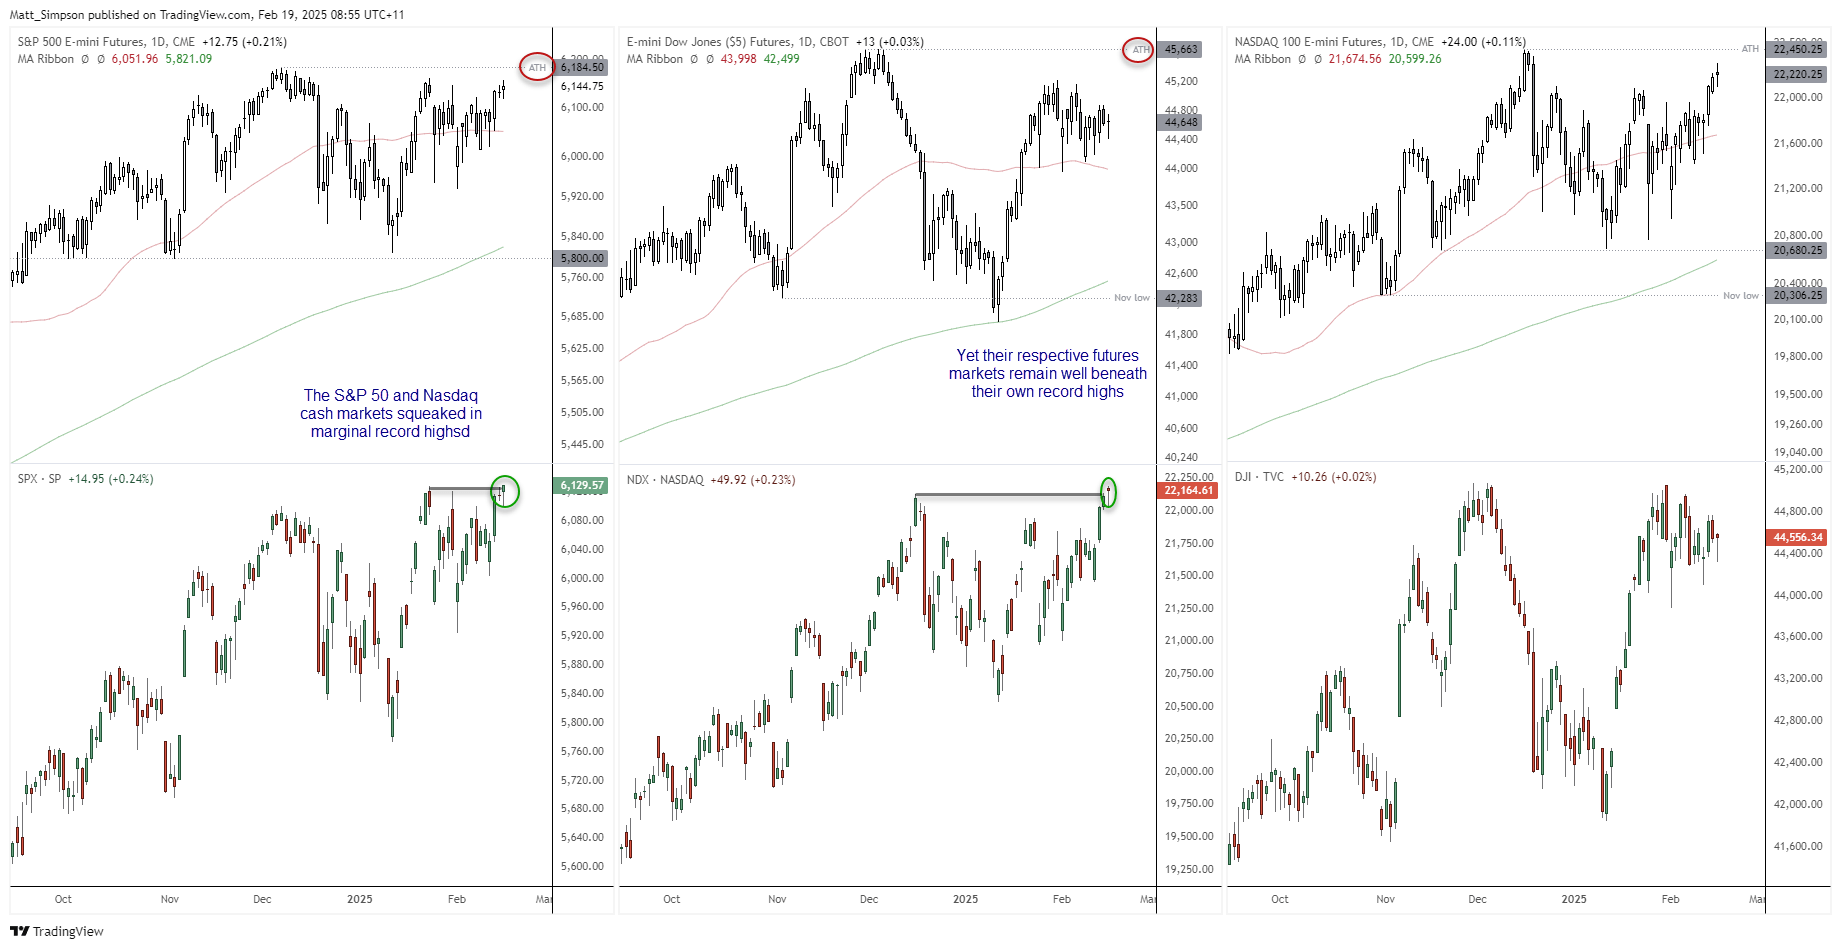
The S&P 500 and Nasdaq 100 cash indices squeezed in marginal record highs ahead of the FOMC minutes and large retail sales earnings, released later this week. Their daily ranges were small and the closes did not clear their previous record highs enough for me to feel comfortable that the gains will be sustained at this point. Furthermore, their respective futures markets remain beneath their own record highs, which adds to the suspense of whether the rally will continue or pull back first.
Economic events in focus (AEDT)
- 10:00 – JP Reuters Tankan index
- 10:50 – JP trade balance, machinery orders
- 11:30 – AU wage price index, RBA chart pack
- 12:00 – RBNZ interest rate decision
- 12:30 – CN house prices
- 13:00 – US President Trump speaks
- 13:00 – RBNZ press conference
- 18:00 – UK CPI, PPI
- 06:00 – FOMC meeting minutes
ASX 200 futures (SPI 200) technical analysis:
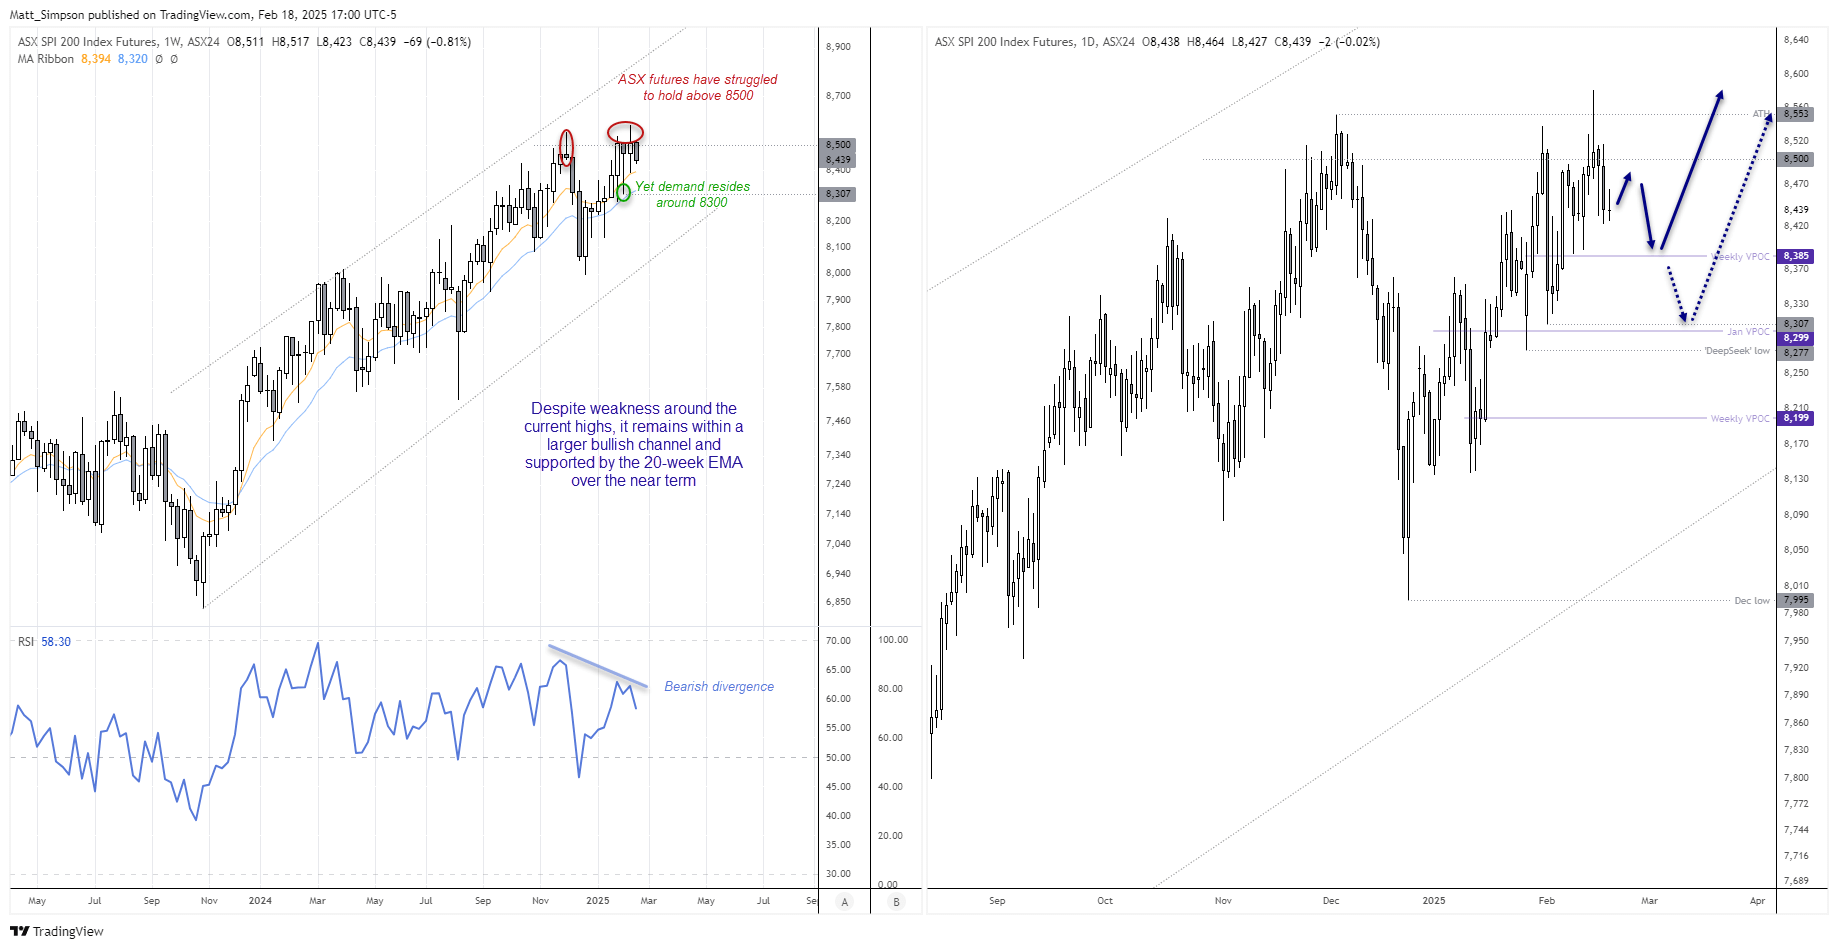
The ASX remains in an established uptrend in the weekly chart, and trades in a larger bullish channel. However, a bearish divergence is forming and prices are struggling to hold above 8500 for any length of time. A less-dovish RBA is suppressing prices for now, and we could be looking at a deeper pullback should Wall Street stumble. However, I have a sneaking suspicion that it won’t, and that could keep any pullback on the ASX limited.
The daily chart shows support could reside around the weekly VPOC (volume point of control) at 8285, a break beneath which brings 8300 into focus near the January VPOC and 8307 low. Also note that the 8307 low is a bullish hammer which to me suggests demand in the area and assumes and eventual bullish breakout.
Therefore, a break below 8300 invalidates my bias that the ASX will break to new highs before touching 8300.
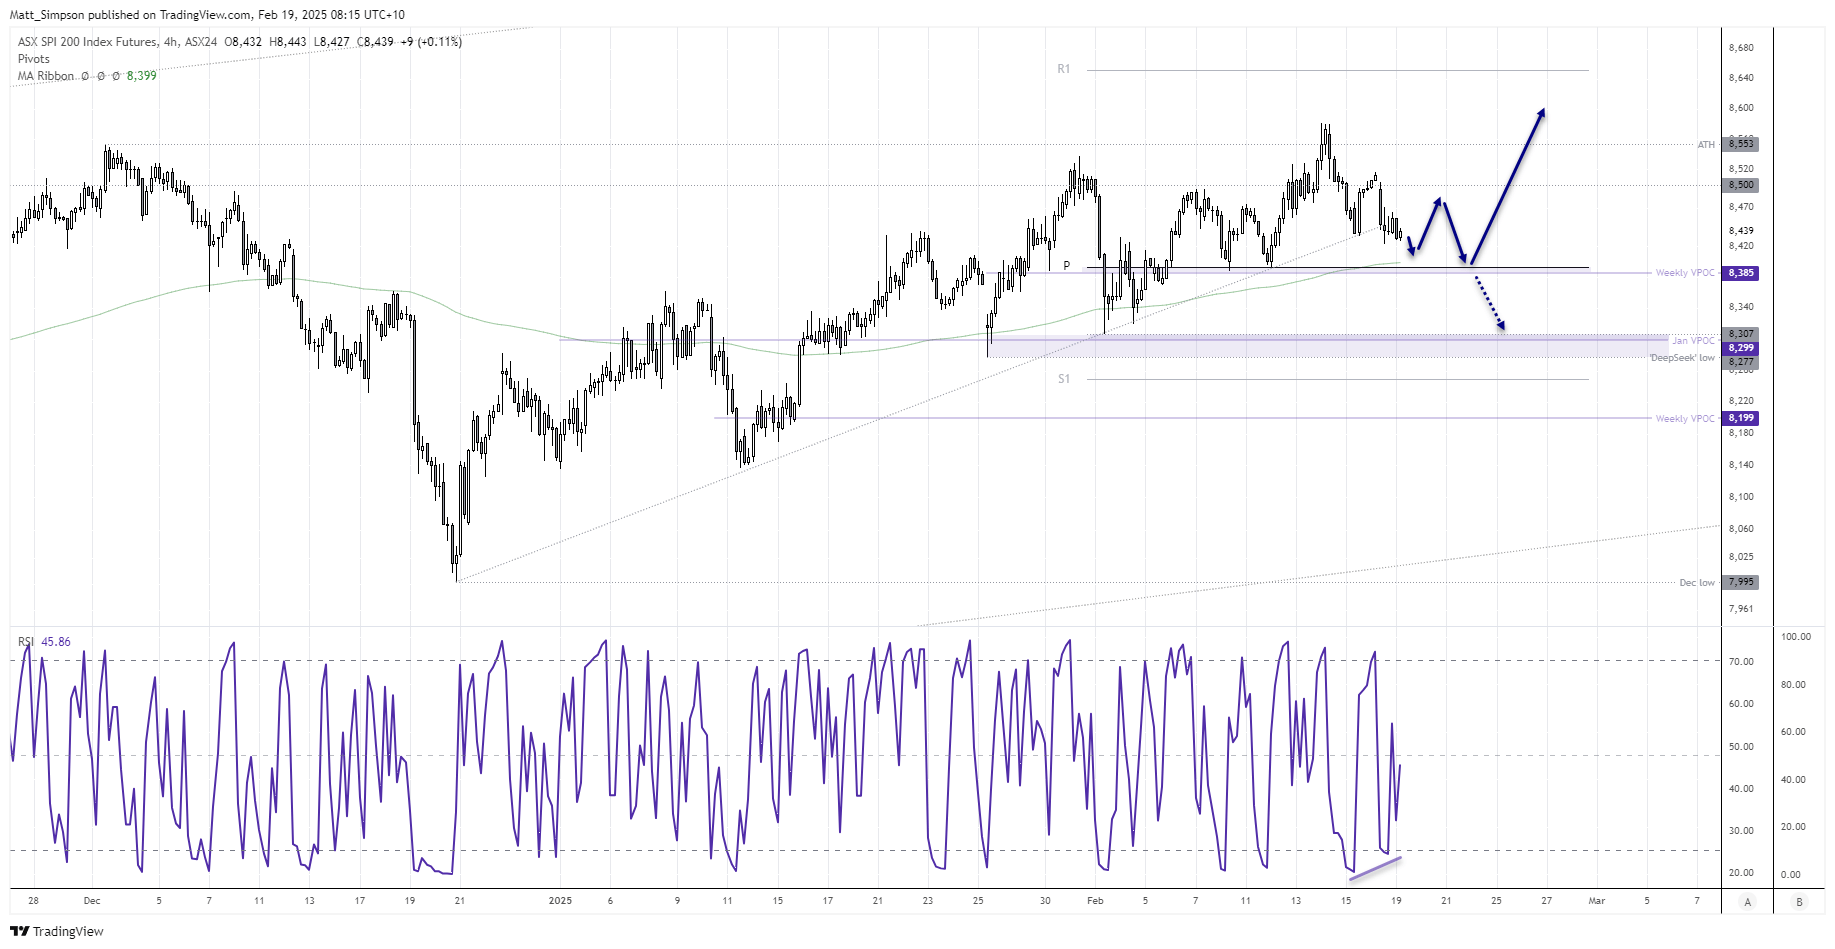
The 4-hour chart shows prices invalidated a bullish trendline. However, prices are coiling near the cycle low around the breakdown level, which shows a lack of conviction from bears. A bullish divergence is also forming on the RSI (2).
Let’s see what happens at the open, but I suspect any initial down move could be limited and, ultimately, a false move. And that we could see prices head for 8500 before heading got the intimal support level around 8385, a break beneath which brings 8340 and 8307 into focus.
View the full economic calendar
View the full economic calendar
-- Written by Matt Simpson
Follow Matt on Twitter @cLeverEdge
How to trade with City Index
You can trade with City Index by following these four easy steps:
- Open an account, or log in if you’re already a customer
• Open an account in the UK
• Open an account in Australia
• Open an account in Singapore
- Search for the market you want to trade in our award-winning platform
- Choose your position and size, and your stop and limit levels
- Place the trade
Latest market news




The complete CFD trading experience
Award-winning platforms, competitive spreads, low commissions and dedicated support.
We live and breathe the markets and are dedicated to helping traders realise their ambitions as we continue to set the industry bar.
Economic calendar
Web Trader platform
Our sophisticated web-based platform is packed with features.
Related articles
EUR/USD weekly outlook: FOMC and ECB to set the tone
The current backdrop is modestly bearish. On Friday, the EUR/USD closed modestly lower, down for the third consecutive day. The pair also posted a weekly decline after staging a modest recovery attempt in the previous week. Out of the past 8 weeks, the EUR/USD has fallen on 6 occasions. There is not much supporting factors for the single currency right now. So, the upside remains capped.

Silver forecast: metals liquidation drags XAG/USD into $50-55 support
Silver has broken its July low and slipped into a long-term support zone as the selling in precious metals deepens. The chart shows where the metal could bottom, and next week's Fed decision may decide whether it does.

S&P 500 forecast: AI linked stocks remain under pressure
And just like that, it is Friday again and the end of a volatile week. Today offers little on the macro calendar to change the prevailing narrative, leaving markets largely at the mercy of risk appetite, oil prices and the growing unease around the AI trade.
StoneX Europe Ltd may make third party material available on this website which may contain information included but not limited to the conditions of financial markets. The material is for information purposes only and does not contain, and should not be construed as containing, investment advice and/or investment recommendation and/or an investment research and/or an offer of or solicitation for any transactions in financial instruments; any decision to enter into a specific transaction shall be made by the client following an assessment by him/her of their situation.
StoneX Europe Ltd makes no representation or warranty and assumes no liability as to the accuracy or completeness of the information provided, nor any loss arising from any investment based on a recommendation, forecast or other information supplied. You should always seek independent advice as to your suitability to speculate in any related markets and your ability to assume the associated risks, if you are at all unsure. We are not under any obligation to update any such material. Any opinion made may be personal to the author and may not reflect the opinion of StoneX Europe Ltd.