



AU Q2 2022 GDP review and what comes next for the AUDUSD
The national accounts released today showed the Australian economy in the June Quarter expanded by a solid 0.9% and 3.6% YoY. It's the third consecutive quarter of economic expansion for the Australian economy.
Share this:

The national accounts released today showed the Australian economy in the June Quarter expanded by a solid 0.9% and 3.6% YoY. It's the third consecutive quarter of economic expansion for the Australian economy.
The first full quarter of re-opened domestic and international borders was behind a substantial rise in consumer spending and net export growth, offsetting weakness in housing and inventories.
Drilling down into the details, household spending rose by 2.2% as spending on services increased 3.6%, exceeding pre-pandemic levels for the first time. Hotels, cafes, and restaurants (+8.8%), transport services (+37.3%) and recreation and culture (+3.6%) were the main drivers.
Exports of goods and services contributed 1.1 percentage points to GDP growth. The rises were broad-based across rural and mining goods and services exports. Exports of services rose 13.7%, reflecting education-related travel as international students returned to Australia.
Australia's Terms of Trade rose 4.6% during the quarter, contributing 1.0 percentage points to GDP growth, driven by a strong rise in exports (+5.5%), while imports recorded a partly offsetting rise (+0.7%).
Following an unprecedented inventory build-up of $7.8 billion in March, changes in inventories recorded a more moderate build-up of $1.6 billion this quarter, detracting 1.2 percentage points from GDP growth.
Ongoing disruption in the building industry stemming from wet weather and material and labour shortages saw a 2.9% fall in Dwelling activity, following a 4.6% fall in Q1. Non-residential fell by 5% following a 2% fall in Q1.
The household saving ratio declined from 11.1% to 8.7% remaining slightly above pre-pandemic levels but a long way from the 19.8% level it reached in Q3 2021. The fall in the savings rate coming as consumers continue to open their wallets, shop up a storm, and travel abroad.
Today's figures coincided with the start of the RBA's rate hiking cycle in May and come just one day after the RBA raised rates by 50bps to 2.35%, leaving Q3 as the one that should reveal the impact of the RBA's 225bp of rate hikes to date.
While the statement that accompanied yesterday's decision hinted at a more moderate pace of rate rises, more clues may be forthcoming from the RBA Governors' Speech at the Annika Foundation lunch tomorrow.
What does it mean for the AUDUSD?
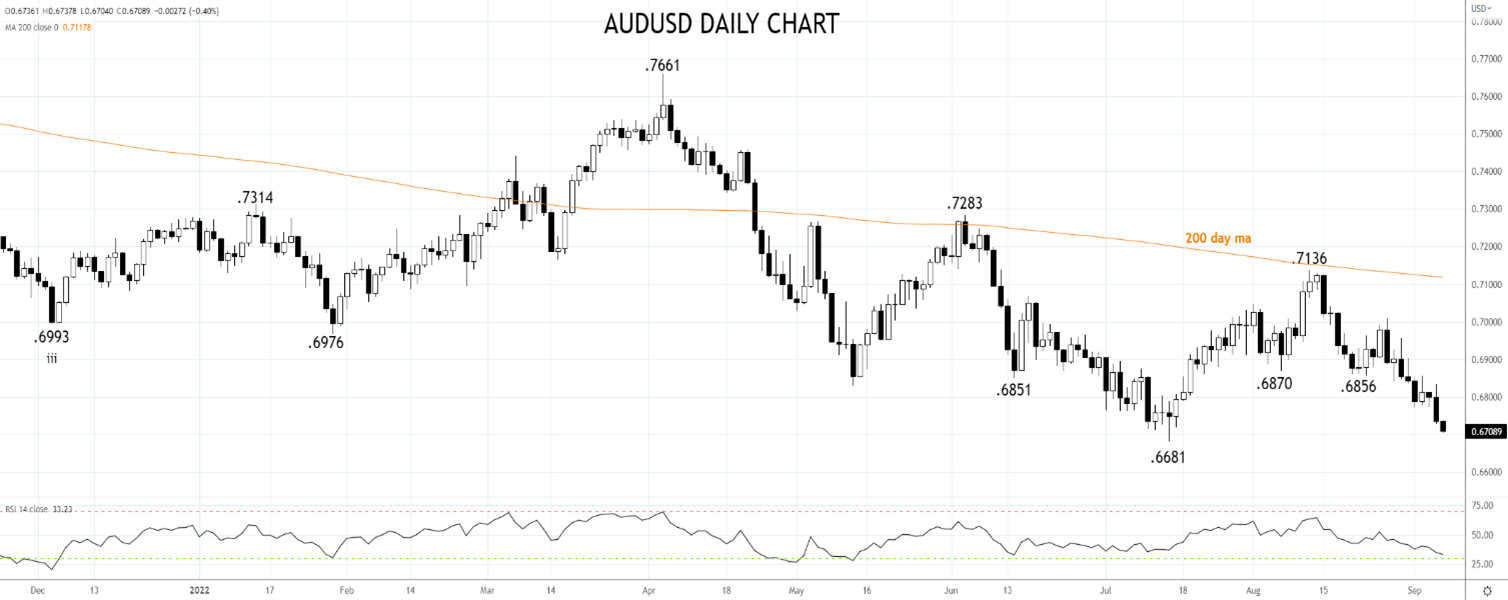
Following the failure to break above resistance at .6850/70 earlier this week, the AUDUSD is lurching towards the June .6681 low, unable to withstand the heat of an unrelenting rise in the U.S dollar and in USDCNY.
A break/close below .6681 would then see the AUDUSD move towards the next level of support, .6530/00.
Source Tradingview. The figures stated are as of 7th of Sept 2022. Past performance is not a reliable indicator of future performance. This report does not contain and is not to be taken as containing any financial product advice or financial product recommendation
How to trade with City Index
You can trade with City Index by following these four easy steps:
- Open an account, or log in if you’re already a customer
• Open an account in the UK
• Open an account in Australia
• Open an account in Singapore
- Search for the company you want to trade in our award-winning platform
- Choose your position and size, and your stop and limit levels
- Place the trade
The national accounts released today showed the Australian economy in the June Quarter expanded by a solid 0.9% and 3.6% YoY. It's the third consecutive quarter of economic expansion for the Australian economy.
The first full quarter of re-opened domestic and international borders was behind a substantial rise in consumer spending and net export growth, offsetting weakness in housing and inventories.
Drilling down into the details, household spending rose by 2.2% as spending on services increased 3.6%, exceeding pre-pandemic levels for the first time. Hotels, cafes, and restaurants (+8.8%), transport services (+37.3%) and recreation and culture (+3.6%) were the main drivers.
Exports of goods and services contributed 1.1 percentage points to GDP growth. The rises were broad-based across rural and mining goods and services exports. Exports of services rose 13.7%, reflecting education-related travel as international students returned to Australia.
Australia's Terms of Trade rose 4.6% during the quarter, contributing 1.0 percentage points to GDP growth, driven by a strong rise in exports (+5.5%), while imports recorded a partly offsetting rise (+0.7%).
Following an unprecedented inventory build-up of $7.8 billion in March, changes in inventories recorded a more moderate build-up of $1.6 billion this quarter, detracting 1.2 percentage points from GDP growth.
Ongoing disruption in the building industry stemming from wet weather and material and labour shortages saw a 2.9% fall in Dwelling activity, following a 4.6% fall in Q1. Non-residential fell by 5% following a 2% fall in Q1.
The household saving ratio declined from 11.1% to 8.7% remaining slightly above pre-pandemic levels but a long way from the 19.8% level it reached in Q3 2021. The fall in the savings rate coming as consumers continue to open their wallets, shop up a storm, and travel abroad.
Today's figures coincided with the start of the RBA's rate hiking cycle in May and come just one day after the RBA raised rates by 50bps to 2.35%, leaving Q3 as the one that should reveal the impact of the RBA's 225bp of rate hikes to date.
While the statement that accompanied yesterday's decision hinted at a more moderate pace of rate rises, more clues may be forthcoming from the RBA Governors' Speech at the Annika Foundation lunch tomorrow.
What does it mean for the AUDUSD?
Following the failure to break above resistance at .6850/70 earlier this week, the AUDUSD is lurching towards the June .6681 low, unable to withstand the heat of an unrelenting rise in the U.S dollar and in USDCNY.
A break/close below .6681 would then see the AUDUSD move towards the next level of support, .6530/00.
Source Tradingview. The figures stated are as of 7th of Sept 2022. Past performance is not a reliable indicator of future performance. This report does not contain and is not to be taken as containing any financial product advice or financial product recommendation
Related tags:
Latest market news




The complete CFD trading experience
Award-winning platforms, competitive spreads, low commissions and dedicated support.
We live and breathe the markets and are dedicated to helping traders realise their ambitions as we continue to set the industry bar.
Economic calendar
Web Trader platform
Our sophisticated web-based platform is packed with features.
Related articles
US Dollar Short-term Outlook: USD Rally on the Line as Midterms, NFP Loom 11 3 2026
DXY is testing pivotal support, with the weekly range breakout likely to determine the next major leg of the trend as key event risk unfolds.

Nasdaq 100 forecast: Stocks rebound but AI concerns linger
The Nasdaq 100 was finding some support at 28,000 after recent sell-off amid concerns about the AI trade. Even with oscillators oversold, the risk to the near-term forecast is tilted to the downside.

USD/JPY Analysis: Rising U.S. Yields Leave the Yen on the Defensive
As the first week of November progresses, renewed weakness in the Japanese yen is once again becoming evident in the short term. This dynamic can be seen in the recent performance of USD/JPY, which has posted two consecutive bullish sessions and gained more than 0.7%, reflecting a return of buying interest in the dollar while the yen continues to lose momentum.
StoneX Europe Ltd may make third party material available on this website which may contain information included but not limited to the conditions of financial markets. The material is for information purposes only and does not contain, and should not be construed as containing, investment advice and/or investment recommendation and/or an investment research and/or an offer of or solicitation for any transactions in financial instruments; any decision to enter into a specific transaction shall be made by the client following an assessment by him/her of their situation.
StoneX Europe Ltd makes no representation or warranty and assumes no liability as to the accuracy or completeness of the information provided, nor any loss arising from any investment based on a recommendation, forecast or other information supplied. You should always seek independent advice as to your suitability to speculate in any related markets and your ability to assume the associated risks, if you are at all unsure. We are not under any obligation to update any such material. Any opinion made may be personal to the author and may not reflect the opinion of StoneX Europe Ltd.