


AUD/USD, NZD/USD face explosive CPI, RBNZ doubleheader
Aussie and Kiwi have gone remarkably quiet ahead of Australian inflation data and RBNZ decision. With substantial tightening priced and both events capable of generating major FX swings, Wednesday could deliver a volatility eruption in the antipodes.
Share this:

- Australian CPI and RBNZ arrive back-to-back on Wednesday
- Historical data reveal substantial FX volatility following both events
- AUD/USD and NZD/USD corrective rebounds have stalled beneath resistance
- AUD/NZD maintains strong links with relative two-year bond yields
Wednesday is shaping up to be a big day for antipodean FX traders, with a potentially explosive 30-minute window preceding what could be the main course: the Federal Reserve's October interest rate decision.
Australian inflation figures land just half an hour before the RBNZ's interest rate decision, bringing together two events with a history of generating substantial volatility. Yet AUD/USD and NZD/USD find themselves trading in unusually narrow ranges ahead of them, having stalled following recent corrective rebounds.
With traders pricing in substantial further tightening from both central banks, the question isn't simply what the data and decisions deliver, but whether they can live up to the hawked-up hype.
RBNZ faces a high bar to satisfy Kiwi bulls
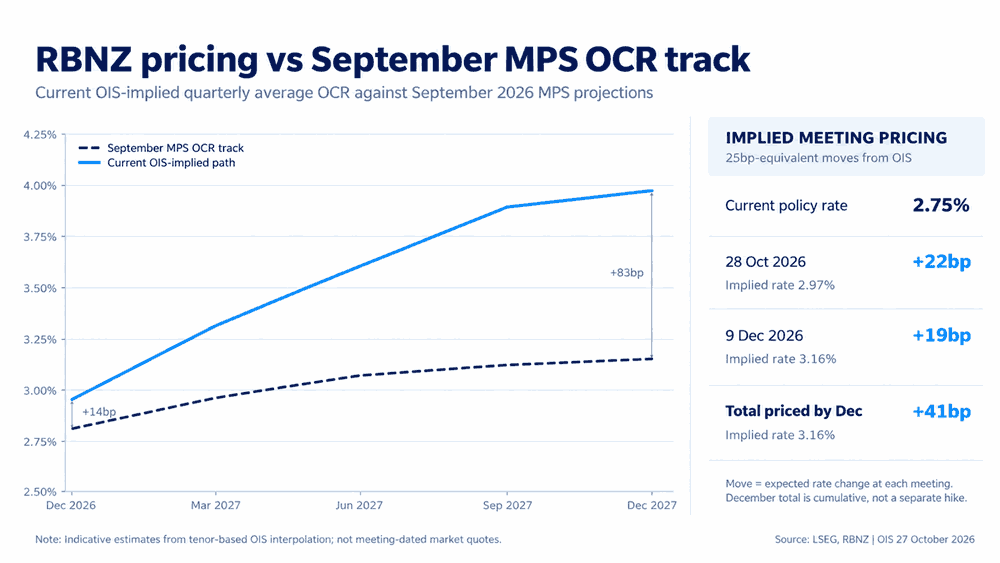
With swaps pricing around 22 basis points of tightening, the RBNZ is overwhelmingly expected to deliver another 25 basis point hike on Wednesday.
Source: LSEG, RBNZ
When the RBNZ kicked off its tightening cycle in September, the accompanying guidance was dovish relative to market pricing, with the bank favouring a gradual removal of monetary stimulus and offering only a very modestly hawkish cash rate track. Fast forward to today, and we now have 41 basis points of tightening priced by the bank's December meeting, implying not only a strong chance of a hike tomorrow, but a substantial probability of two full 25 basis point moves by Christmas.
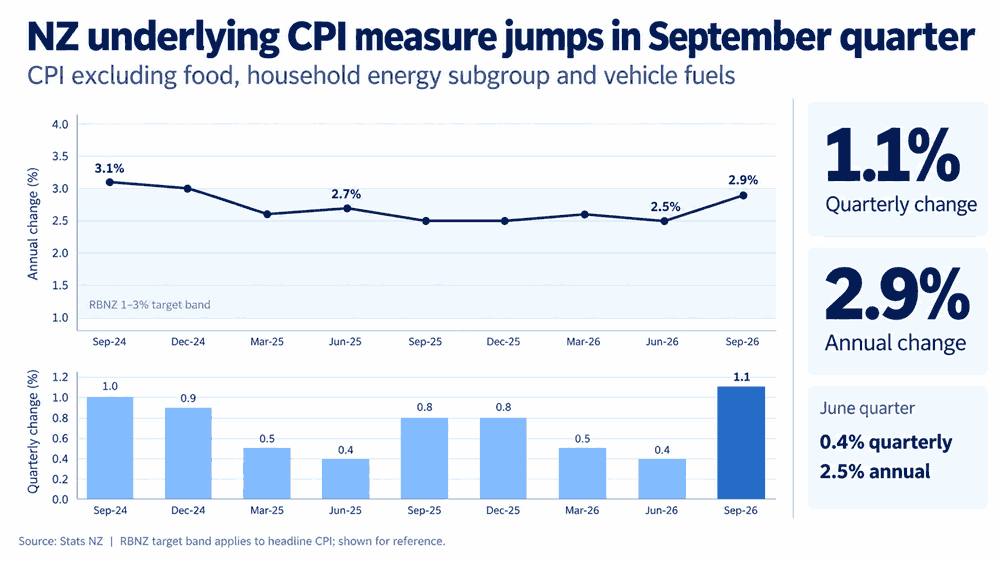
To be sure, there's justification for the shift with persistently elevated energy prices and a weaker kiwi feeding inflationary pressures into the economy. Last week's inflation report revealed that underlying inflation has accelerated towards the top of the RBNZ's 1–3% target band, even though headline inflation came in slightly beneath the bank's forecast in the September quarter. Recent soft economic data also suggest the recovery, while still in its infancy, hasn't broken down as a result of the energy price shock.
Source: LSEG, StatsNZ
With no fresh forecasts or updated cash rate track tomorrow, outside of the decision, the tone of the statement will be critical, particularly the final paragraph where the bank often signals its policy bias. The deliberations among committee members in the meeting minutes and voting split will also be important. Will anyone be prepared to vote against another hike, or could someone be sufficiently concerned about inflation to push for a 50 basis point move? They're the tails traders should be looking out for.
Governor Anna Breman's press conference is another risk event, providing the opportunity to assess how much more tightening the bank may deliver. Given hawkish pricing, a routine 25 basis point hike accompanied by cautious guidance could easily disappoint kiwi bulls.
RBA rate hike bets face their biggest test yet
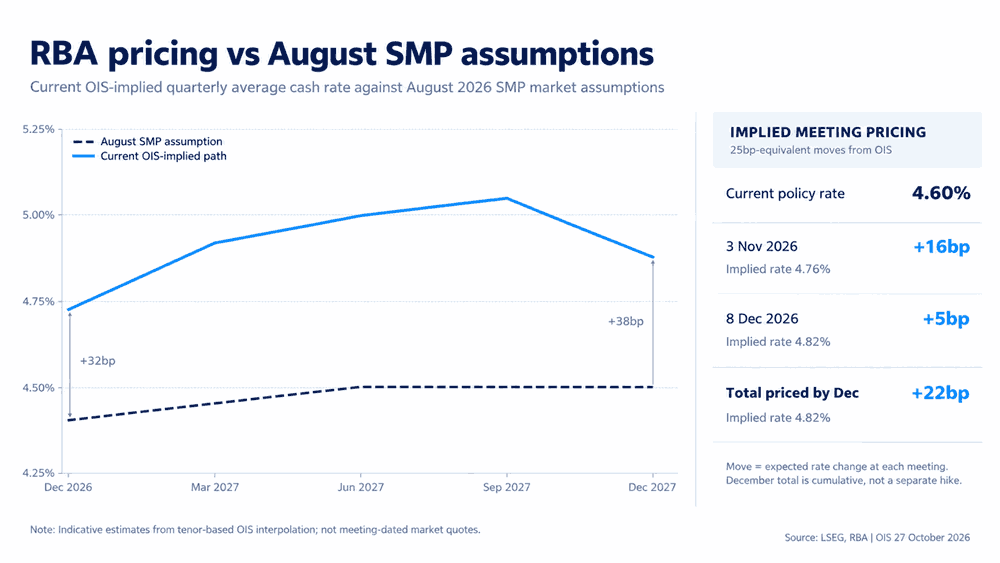
Across the Tasman sea,. there's been a sharp hawkish repricing of the RBA rate outlook over the past week, sparked by comments from Deputy Governor Andrew Hauser that not only rekindled the prospect of a Melbourne Cup Day hike following soft employment data released earlier in the month, but have now tilted pricing heavily in favour of a 25 basis point move.
Hauser warned that the inflation outlook had deteriorated materially since the bank released its forecasts in August, despite signs of a softening labour market and weakening domestic demand. Assistant Governor Sarah Hunter reinforced that message over the weekend. Asked whether the RBA had done enough to defeat inflation after four hikes this year, her response was telling: “Unfortunately, not quite yet.”
Source: LSEG, RBA
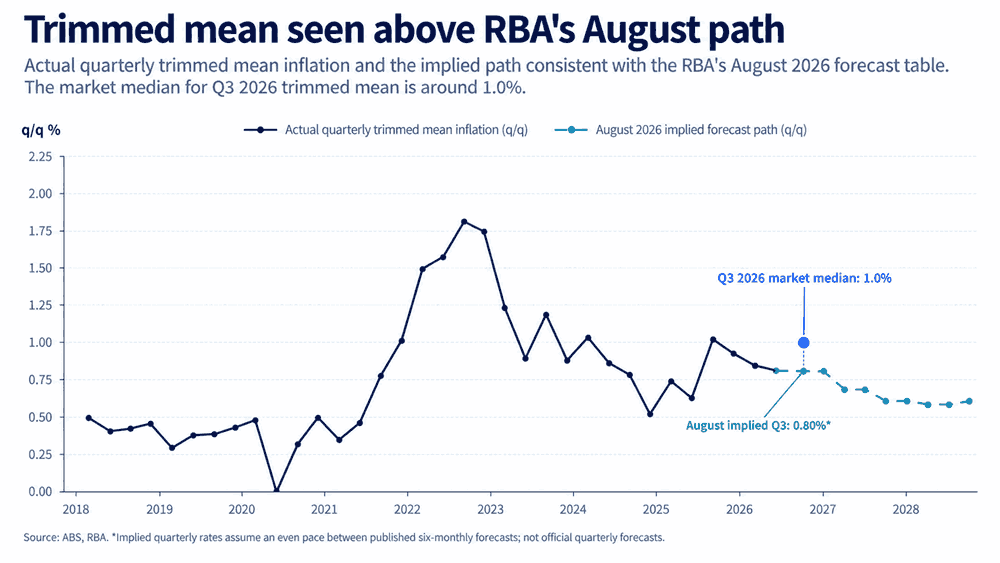
Cash rate futures now imply a 71.1% probability of another hike next Tuesday, a new cycle high. Markets expect quarterly trimmed mean inflation to rise 1%, above the roughly 0.8% implied by the RBA's August forecasts. That's the number to focus on, rather than headline inflation or even the monthly readings, except for what the latter may reveal about the near-term underlying inflation pulse.
Beyond the quarterly trimmed mean figure, traders should be looking closely at market services inflation, given its linkages to labour market conditions, housing costs, which carry the largest weight in the CPI basket, and the overall breadth of price increases. In particular, is there evidence that persistently elevated energy prices are filtering through to other goods and services, as the RBA's liaison program has been warning and Hauser specifically highlighted last week?
Source: LSEG, RBA
With markets heavily priced for another hike, a trimmed mean print around consensus or higher would reinforce expectations of another move next week and potentially a third consecutive increase in December. However, a meaningful downside surprise in trimmed mean inflation would challenge the abrupt increase in hawkish pricing seen over the past week, likely weighing on the Aussie dollar and potentially putting more emphasis back on the faster-than-expected deterioration in the labour market.
Two proven volatility generators, back-to-back
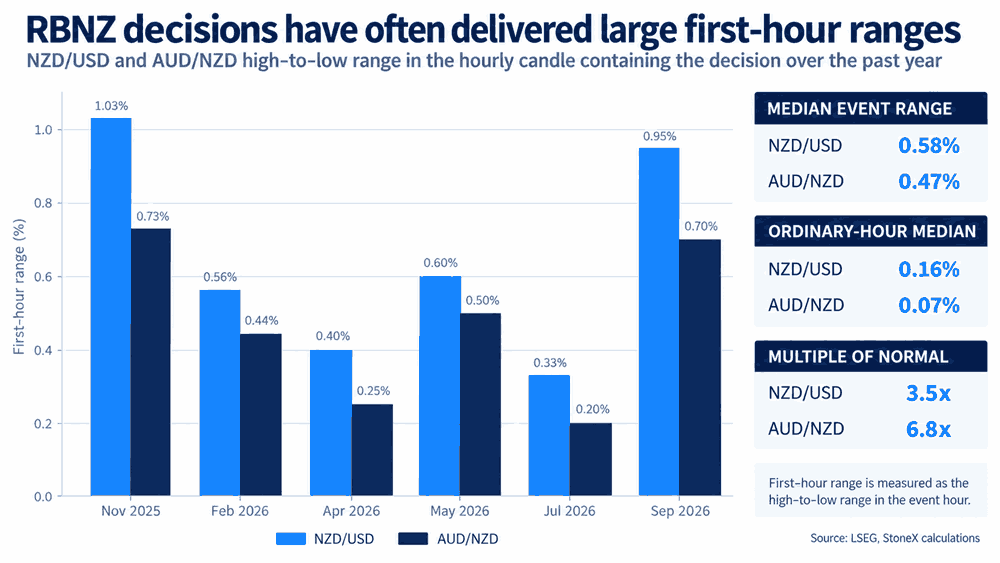
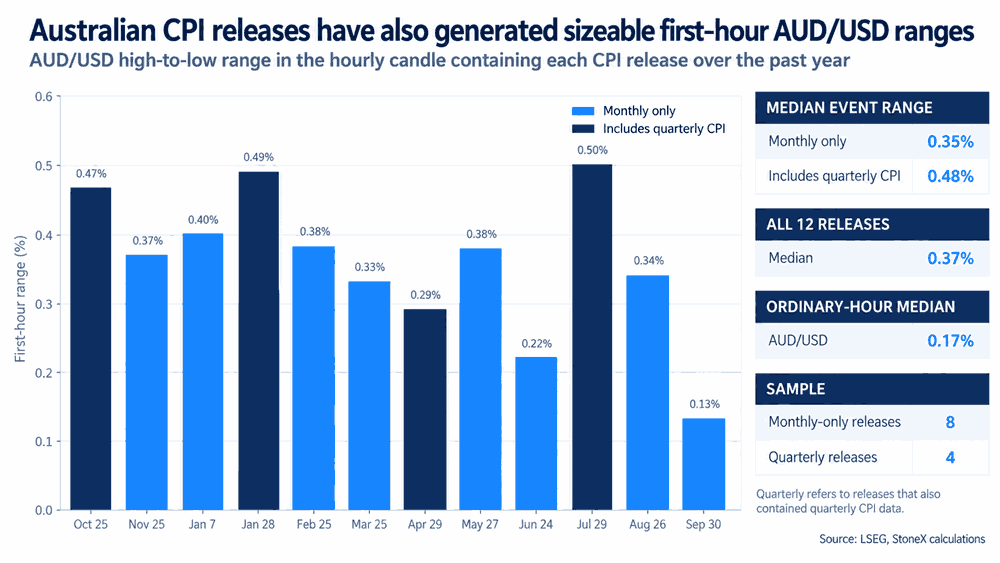
If there's one thing Australian inflation reports and RBNZ interest rate decisions have demonstrated over the past year, it's their ability to generate substantial volatility. And on Wednesday, we're getting both back-to-back.
Source: LSEG
Our analysis of hourly FX data shows that RBNZ decisions have generated a median first-hour trading range of 0.58% in NZD/USD and 0.47% in AUD/NZD, around 3.5 and 6.8 times larger than normal, respectively. Australian inflation releases have also produced significantly larger ranges in AUD/USD, particularly when quarterly figures are included, with a median first-hour range of 0.48%.
Source: LSEG
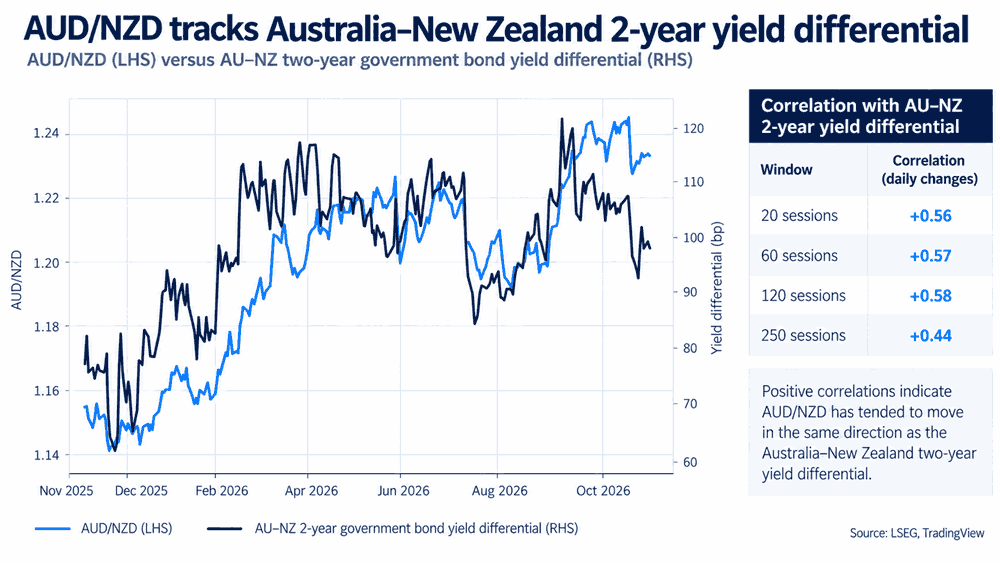
While AUD/USD and NZD/USD will naturally attract plenty of attention, AUD/NZD may offer a more direct expression of relative interest rate expectations and any shifts that result from these events. The cross has maintained a consistently positive relationship with Aussie-Kiwi two-year yield differentials with daily-change correlations of +0.58 over both 60 and 120-session windows.
Source: LSEG
And with the Federal Reserve meeting later in the session, AUD/NZD has the advantage of removing direct US dollar exposure from the equation. That's not to say the Fed won't influence the cross, but its impact may be less pronounced than on the outright pairs
AUD/USD bounce hits a wall at the 100-day average
Source: TradingView
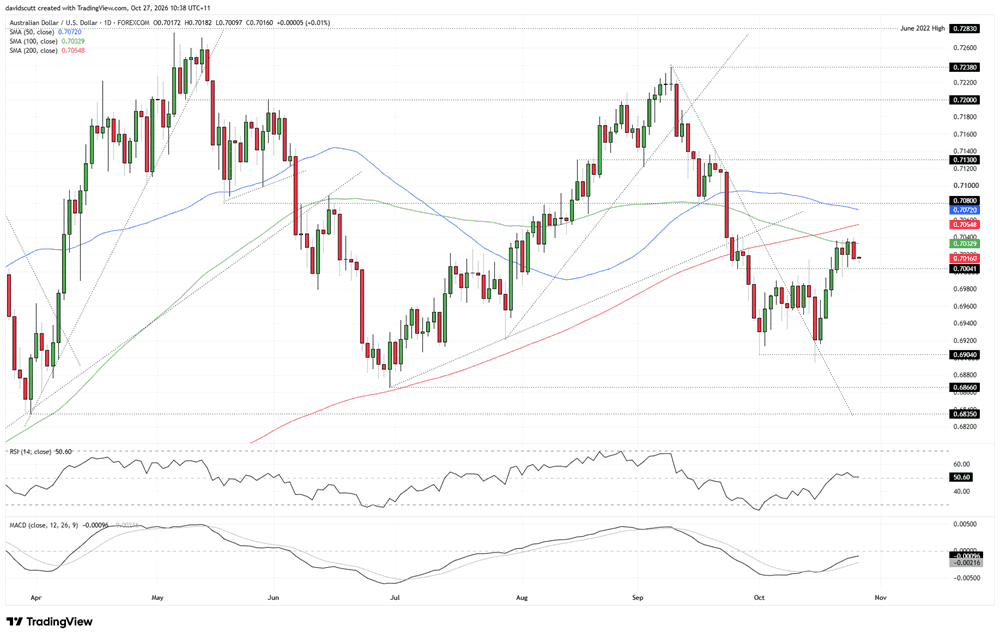
Twin failures around 0.6900 ultimately helped fuel a bullish bounce in AUD/USD, taking the price back above resistance at 0.7004. However, the Aussie hasn't been able to go on with it, with the 100-day moving average basically acting like a saucepan lid overhead. Offers have emerged on every test, while bids remain evident on dips towards 0.7000, leaving the price stuck in a really narrow range.
Looking at the oscillators, RSI (14) is back at 51, which is entirely neutral. MACD has staged a bullish crossover and is moving back towards positive territory, although it remains negative for now. Until proven otherwise, this still looks like a corrective bounce rather than the start of a longer-lasting bullish trend. But that can change.
If AUD/USD manages to clear the 100-day moving average, the next hurdle overhead is the 200-day at 0.7055. Above that sits the confluence of the 50-day moving average and horizontal resistance at 0.7080, a level that has acted as both support and resistance on multiple occasions this year. That's a pretty tough resistance zone for the Aussie to get through.
If it manages to break above that zone, 0.7130 and 0.7200 come into view, followed by 0.7238, the swing high set in early September. On the downside, a break back beneath 0.7004 would leave little in the way of obvious support until 0.6904, making that the next downside target.
NZD/USD trapped in a 30-pip range
Source: TradingView
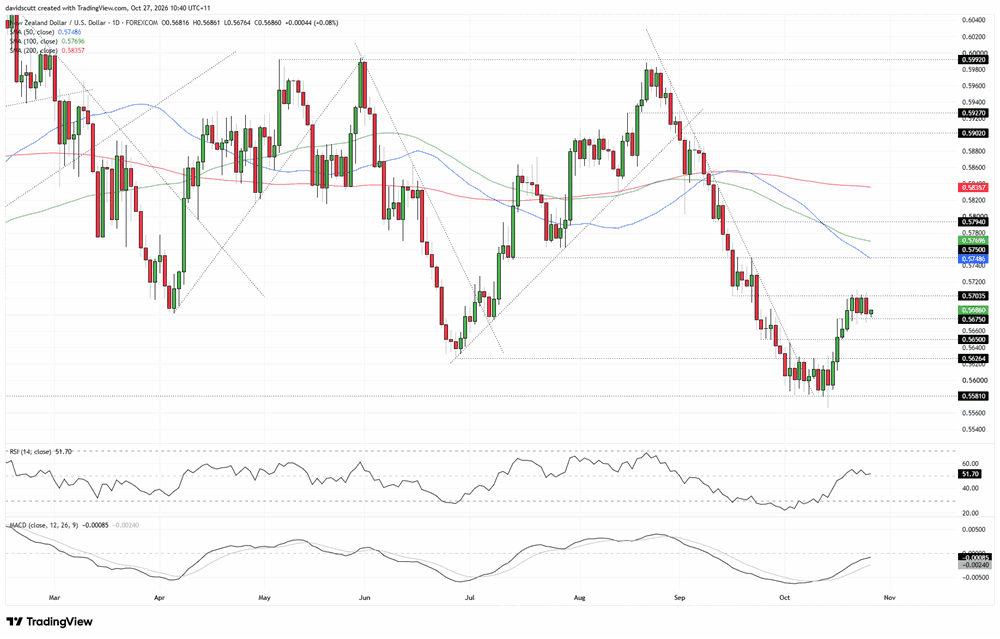
It's a remarkably similar story when it comes to NZD/USD, with the pair not only trading in a narrow range between 0.5703 overhead and 0.5675 on the downside, but the daily candles have also been almost identical in magnitude. It's been a game of pong within a range of less than 30 pips.
That gives traders two clear levels to work with on either side of where the price currently trades.
Overhead, there's the confluence of the 50-day moving average and 0.5750, which has acted as support and resistance for periods earlier this year, followed by the 100-day moving average at 0.5770 and then 0.5794.
Again, like AUD/USD, until proven otherwise, this is a corrective bounce rather than the start of a longer-lasting bullish trend. That point is reinforced by the oscillators, with RSI (14) basically meandering just above 50, while MACD has staged a bullish crossover but remains in negative territory.
If we were to see the lower side of the current sideways range broken, the levels to watch are 0.5650, 0.5624 and then 0.5581, where bids were constantly absorbing offers in late September and early October.
AUD/NZD directional risks become more balanced
Source: TradingView
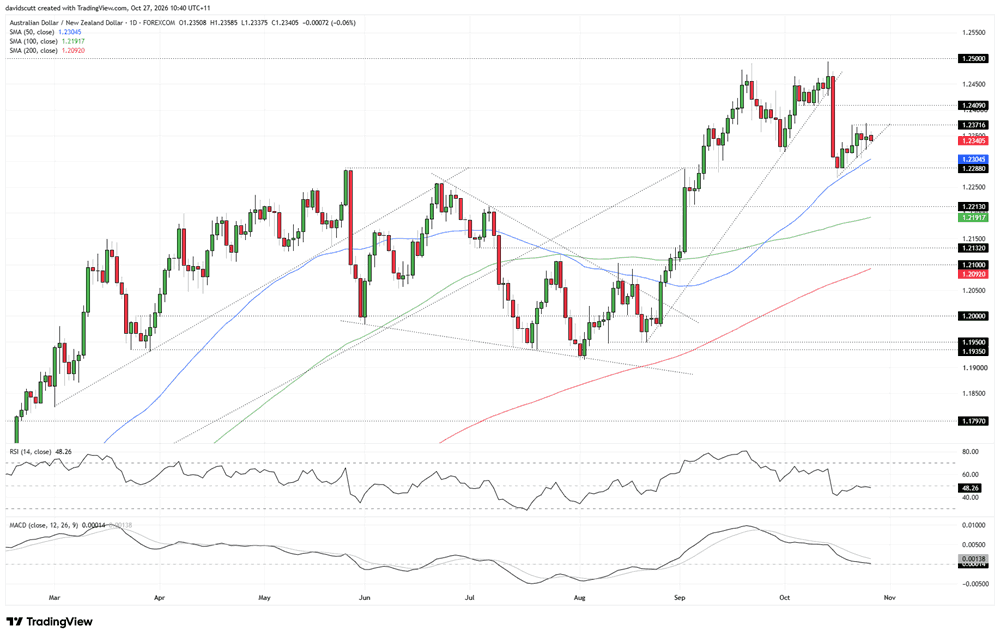
After the abrupt uptrend break sparked by Australia's soft September employment report released in the middle of the month, AUD/NZD has since found itself grinding higher after failing to break beneath support at 1.2288.
Right now, the price sits in a structure resembling something akin to a minor ascending triangle, with resistance overhead at 1.2372 and an uptrend running from the lows set on October 16.
While the pattern may suggest an eventual topside break, I'm keeping an open mind on directional risk, particularly with the starting point for the RBA cash rate now considerably more restrictive than the RBNZ, where it's still arguably in accommodative territory. And given the ties between AUD/NZD and interest rate differentials, to me there's more scope for downside than upside in this particular pair.
Above 1.2372, levels of note are 1.2409, which acted as support for a period in early October, with 1.2490–1.2500 a far more pronounced resistance zone for traders to monitor.
If we were to see the minor uptrend broken, the 50-day moving average and 1.2288 support form the first downside zone of note, with 1.2213, the 100-day moving average, 1.2132 and 1.2100 other levels to watch. The latter is especially important given we're about to see the 200-day moving average intersect with it.
While RSI (14) sits back in neutral territory, what's notable is the sequence of lower highs printed over the past couple of months, suggesting the really strong upside momentum that accompanied the pair for a long period this year is now nowhere to be seen.
MACD delivers a complementary signal, having staged a bearish crossover and now flatlining just in positive territory. It's not an outright bearish message by any stretch of the imagination, but it suggests directional risks on the daily timeframe are now far more balanced than they were during periods earlier this year.


The complete CFD trading experience
Award-winning platforms, competitive spreads, low commissions and dedicated support.
We live and breathe the markets and are dedicated to helping traders realise their ambitions as we continue to set the industry bar.
Economic calendar
Web Trader platform
Our sophisticated web-based platform is packed with features.
Related articles
AUD/USD, NZD/USD face explosive CPI, RBNZ doubleheader
Aussie and Kiwi have gone remarkably quiet ahead of Australian inflation data and RBNZ decision. With substantial tightening priced and both events capable of generating major FX swings, Wednesday could deliver a volatility eruption in the antipodes.

USD/JPY bulls back in business as AI trade roars back
The AI investment boom rolls on, with Anthropic and Meta helping revive enthusiasm across Wall Street. USD/JPY has responded with a bullish reversal pattern, putting its former trading range back in focus ahead of major central bank decisions and technology earnings.

Fed, DXY, EUR/USD, GBP/USD, USD/CAD, Gold Weekly Technical Outlook 10 26 2026
Sr. Technical Strategist Michael Boutros highlights the levels that matter on the USD Majors, commodities, and equity indices charts this week.

StoneX Europe Ltd may make third party material available on this website which may contain information included but not limited to the conditions of financial markets. The material is for information purposes only and does not contain, and should not be construed as containing, investment advice and/or investment recommendation and/or an investment research and/or an offer of or solicitation for any transactions in financial instruments; any decision to enter into a specific transaction shall be made by the client following an assessment by him/her of their situation.
StoneX Europe Ltd makes no representation or warranty and assumes no liability as to the accuracy or completeness of the information provided, nor any loss arising from any investment based on a recommendation, forecast or other information supplied. You should always seek independent advice as to your suitability to speculate in any related markets and your ability to assume the associated risks, if you are at all unsure. We are not under any obligation to update any such material. Any opinion made may be personal to the author and may not reflect the opinion of StoneX Europe Ltd.