




AUD/USD Outlook: RBA Rate Cut Likely as Inflation Hits 3.5-Year Low
Australian CPI slowed to a multi-year low in May, boosting expectations for a July rate cut – though AUD/USD is yet to take note.
Share this:

RBA Cut in Focus as Australian Inflation Slows Sharply in May
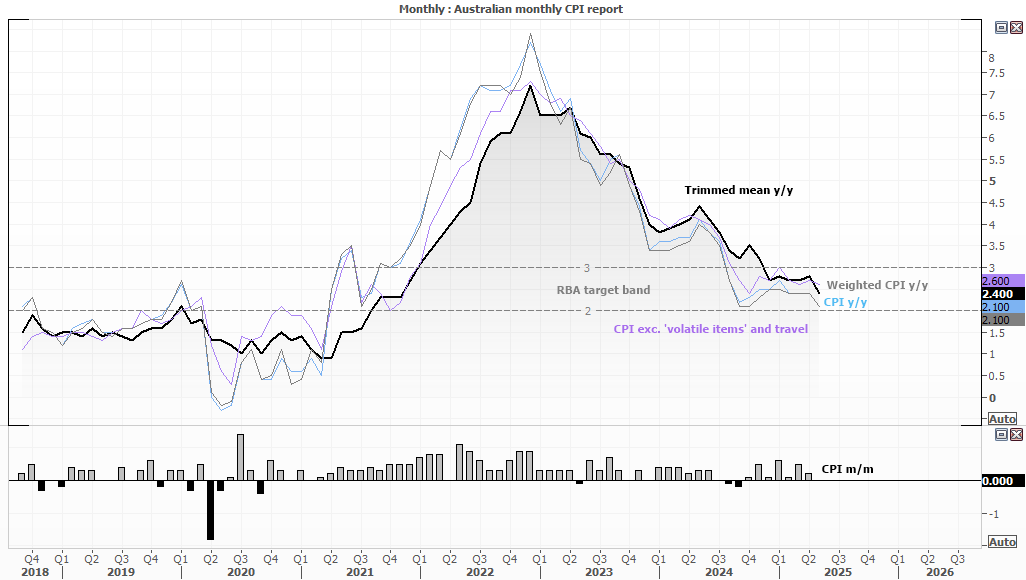
Australia’s inflation figures for May have all but confirmed a 25bp rate cut from the Reserve Bank of Australia (RBA) on July 8. This has been my preference for a couple of months now, though some economists have been playing it safely and spreading their bets for a cut in either July or August. But with inflation slowing to a 3.5 year low, the RBA could find it quite difficult to justify holding rates in two weeks’ time.
View related analysis:
- AUD/JPY Risks Breakdown as Momentum Fades Below 95.00 Resistance
- AUD/USD Weekly Outlook: Aussie Slides as Oil Surges on Middle East Tensions
- Australian Dollar Outlook: Will AUD/USD Follow NZD/USD Lower?
- AUD/USD, USD/CNH Outlook: US Dollar Hits Technical Juncture Ahead of FOMC
View related analysis:
- AUD/JPY Risks Breakdown as Momentum Fades Below 95.00 Resistance
- AUD/USD Weekly Outlook: Aussie Slides as Oil Surges on Middle East Tensions
- Australian Dollar Outlook: Will AUD/USD Follow NZD/USD Lower?
- AUD/USD, USD/CNH Outlook: US Dollar Hits Technical Juncture Ahead of FOMC
Highlights from Australia’s Monthly Inflation Report (May 2025)
- Trimmed-mean inflation slows to a 3-year, seven-month low of 2.4% y/y
- Its -0.4 percentage point drop in May was its fastest in five months
- Weighted CPI slows to a seven-month low of 2.1%
- Headline CPI also slowed to 2.1% y/y and was flat a 0% m/m
Australia’s Money Markets Price in an RBA Cut
The 1-month overnight index swap (OIS) sits at 3.7%, which marks a 60% probability of a 25bp cash rate next month. RBA cash rate futures imply ~90% chance of a cut, which is more in line with the reality of the situation. The 90-day bank bill futures market has fully priced in a 25bp cut to 3.6%, while the 3-year yield has fallen to 3.6%.
AUD/USD and yields to realign?
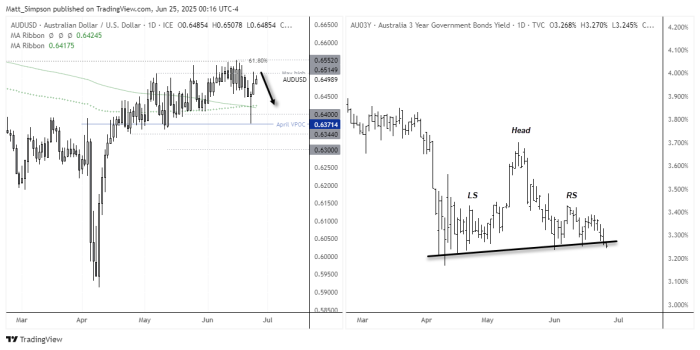
The relationship between yields and currencies broke down amid the Trump-tariff chaos. But with Trump’s trade war now heavily watered down and the Israel-Iran conflict also on its way to the backburner, perhaps the positive correlation between AUD/USD and the 3-year yield could be set to return.
AUD/USD Technical Analysis: Australian Dollar vs US Dollar
A strong bullish pinbar formed on the daily chart of AUD/USD, and marked a false break of the 200-day SMA and EMAs. Prices are trying to rise for a third day despite the soft CPI print, but already its rebound is looking exhausted.
Note that Tuesday closed beneath 65c despite an intraday break above it, and prices have drifted back towards this key level during Asian trade. I suspect this is part of a false move, and bears may be waiting for moves back towards the cycle highs for fade into.
A move to the 200-day MAs around 0.6420 could be on the cards.
Australian 3-Year Yield analysis:
A head and shoulders top is forming on the 3-year yield. I feel it dubious to simply project the distance of the neckline to head for a lower target, as yields are expressed in percentages. But the pattern suggests a downside break for yields could be on the cards. And if I am correct in thinking the Australian dollar could rekindle its relationship with yields, a downside break on the 30year yield could spell trouble for the Australian dollar.
View the full economic calendar
View the full economic calendar
-- Written by Matt Simpson
Follow Matt on Twitter @cLeverEdge
How to trade with City Index
You can trade with City Index by following these four easy steps:
- Open an account, or log in if you’re already a customer
• Open an account in the UK
• Open an account in Australia
• Open an account in Singapore
- Search for the market you want to trade in our award-winning platform
- Choose your position and size, and your stop and limit levels
- Place the trade
Related tags:
Latest market news




The complete CFD trading experience
Award-winning platforms, competitive spreads, low commissions and dedicated support.
We live and breathe the markets and are dedicated to helping traders realise their ambitions as we continue to set the industry bar.
Economic calendar
Web Trader platform
Our sophisticated web-based platform is packed with features.
Related articles
Swiss Franc Forecast: USD/CHF Seven-Week Rally Reverses From Yearly Highs 10 16 2026
A sharp rejection from fresh highs has shifted momentum in favor of USD/CHF bears, raising the stakes for a critical support test.

Nasdaq 100 forecast: Tech stocks not out of woods yet
US index futures pushed higher in the first half of Friday’s session, taking cues from a strong performance from European equities. Both European and US equity futures extending yesterday’s impressive recovery after the sharp sell-off earlier in the week. But the lingering concerns around the AI investment cycle remain, while bond markets were easing lower again, lifting yields.


ASX 200 Outlook: A Rates Trade Disguised as a Stock Market?
Australian bond futures have exhibited a far stronger relationship with the ASX 200 than Wall Street over recent months. Now both markets are displaying remarkably similar price structures.

StoneX Europe Ltd may make third party material available on this website which may contain information included but not limited to the conditions of financial markets. The material is for information purposes only and does not contain, and should not be construed as containing, investment advice and/or investment recommendation and/or an investment research and/or an offer of or solicitation for any transactions in financial instruments; any decision to enter into a specific transaction shall be made by the client following an assessment by him/her of their situation.
StoneX Europe Ltd makes no representation or warranty and assumes no liability as to the accuracy or completeness of the information provided, nor any loss arising from any investment based on a recommendation, forecast or other information supplied. You should always seek independent advice as to your suitability to speculate in any related markets and your ability to assume the associated risks, if you are at all unsure. We are not under any obligation to update any such material. Any opinion made may be personal to the author and may not reflect the opinion of StoneX Europe Ltd.