





AUD/USD Rebound Stalls Near 64c, 200-day EMA; PMIs In Focus
The solid rebound for the Australian dollar over the past two weeks is showing signs of losing steam, with AUD/USD forming a bearish outside day on Tuesday thanks to comments from US Treasury Secretary Scott Bessent boosting the US dollar.
Share this:

View related analysis:
- AUD/USD, Nasdaq Soar as Trump Blinks First, Sparking Epic Market U-Turn
- Tentative Signs of a US Dollar Rebound Ahead of Powell speech
- AUD/USD weekly outlook: The Battler Stages a V-Bottom Recovery
View related analysis:
- AUD/USD, Nasdaq Soar as Trump Blinks First, Sparking Epic Market U-Turn
- Tentative Signs of a US Dollar Rebound Ahead of Powell speech
- AUD/USD weekly outlook: The Battler Stages a V-Bottom Recovery
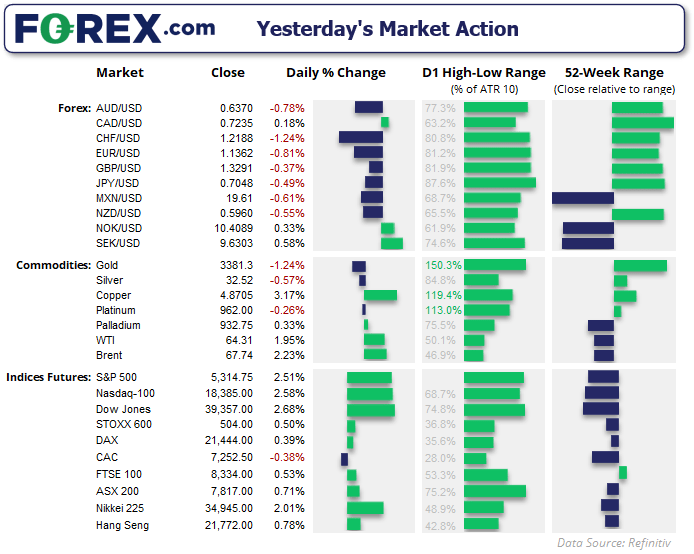
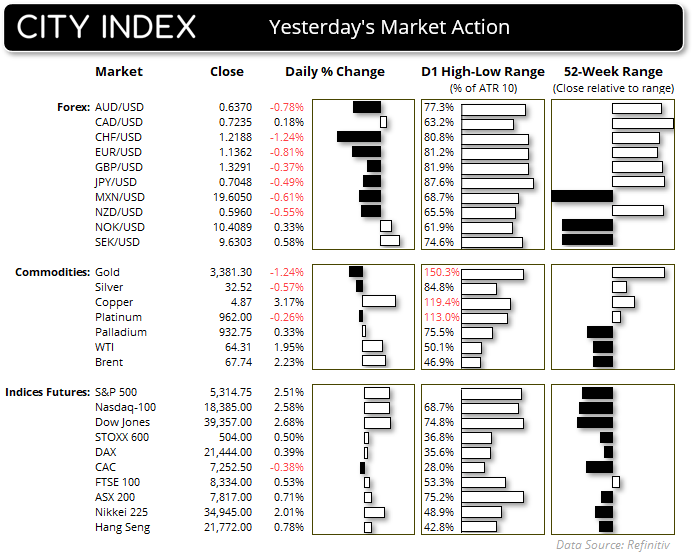
It was a mild risk-on tone on Tuesday, on hopes that US–China trade tensions could recede following comments from US Treasury Secretary Scott Bessent. Speaking at a private investor summit hosted by JP Morgan (JPM), CNC reported that Bessent expects a de-escalation in the trade war with China “very soon”, and that the current status quo of high tariffs is not sustainable.
Wall Street indices were around 2.5% higher, with the S&P 500 and Nasdaq futures forming bullish engulfing days, along with the Dow Jones — the latter of which also snapped a four-day losing streak.
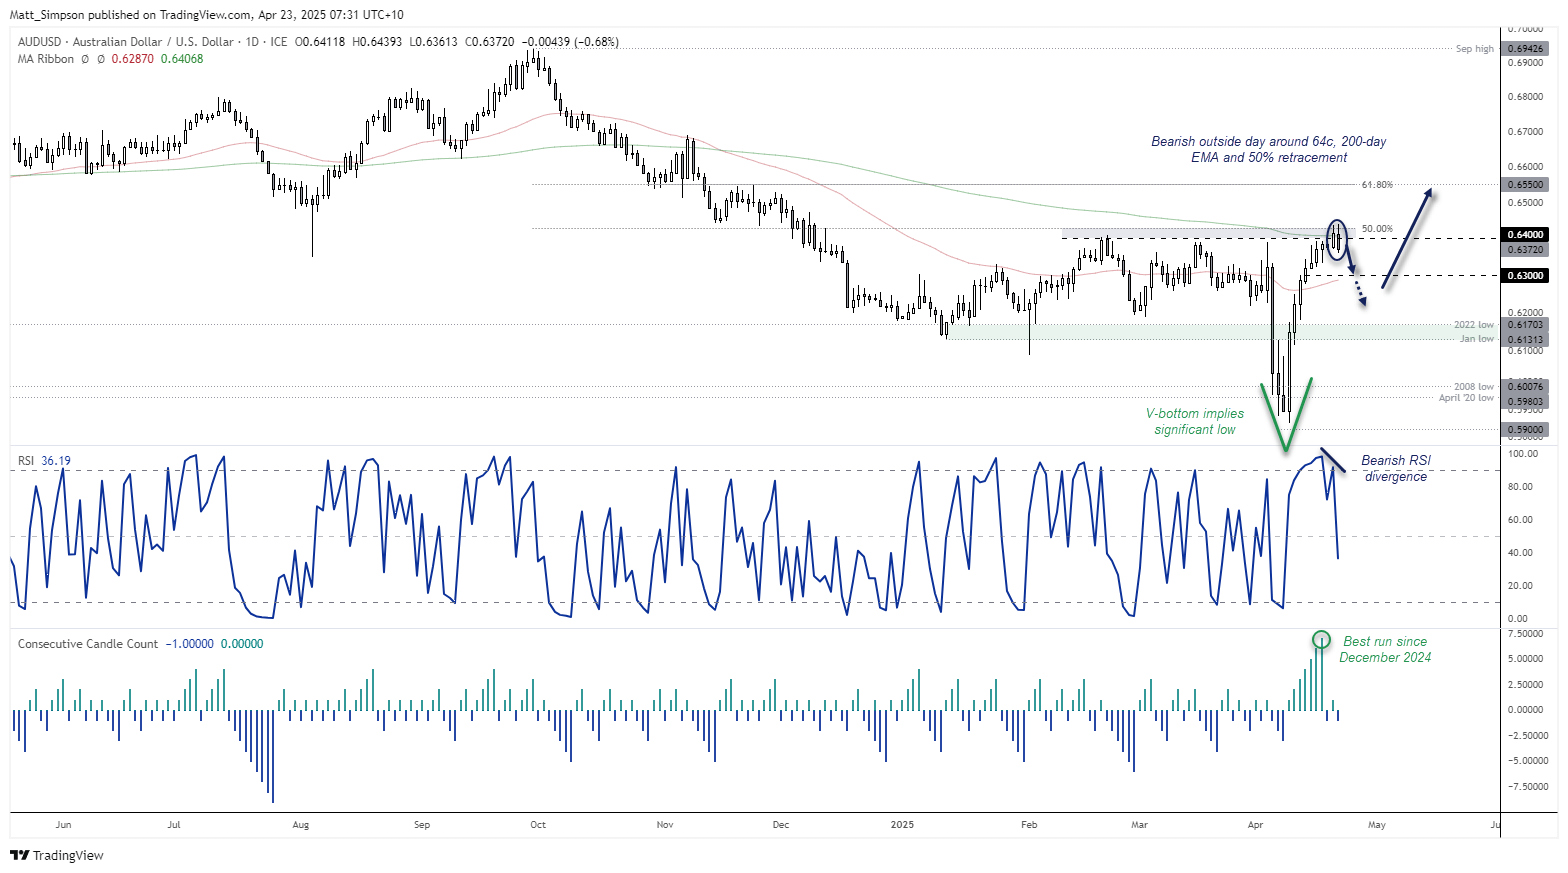
The US Dollar Index rose 0.6% to recoup around three-quarters of Monday’s losses, closing the day back above its December low. This sent EUR/USD back below 1.14 and formed a bearish engulfing day, while helping USD/CAD hold above the November low. However, volatility on the Canadian dollar remains low with Canada’s federal election looming. A weaker Chinese yuan (higher USD/CNH) also helped AUD/USD form a prominent bearish outside day around a cluster of key levels, including the 200-day EMA, 50% retracement level and the 64c handle.
Australian Dollar (AUD/USD) technical analysis
AUD/USD has managed to rebound an impressive 9% in less than two weeks, half of which was achieved on the first day amid its spectacular rebound from 59c. The 4.5% rally on 9 April was thanks to President Trump seemingly blinking first in his own trade war, which marked the Australian dollar’s fourth-best daily return on record and second most volatile.
However, with bearish momentum waning and the rally once again stuttering around 64c, I am on guard for a retracement before an eventual move up to 0.6550.
A bearish outside day formed on AUD/USD on Tuesday, which saw it close back beneath the 200-day EMA and the 64c level. A double top (or tweezer top) also formed around a 50% retracement level, with a bearish RSI divergence already established on the daily chart.
A move to 63c seems feasible, at which point we can reassess its potential for a deeper pullback over a resumption of a rally towards the 0.6550 target.
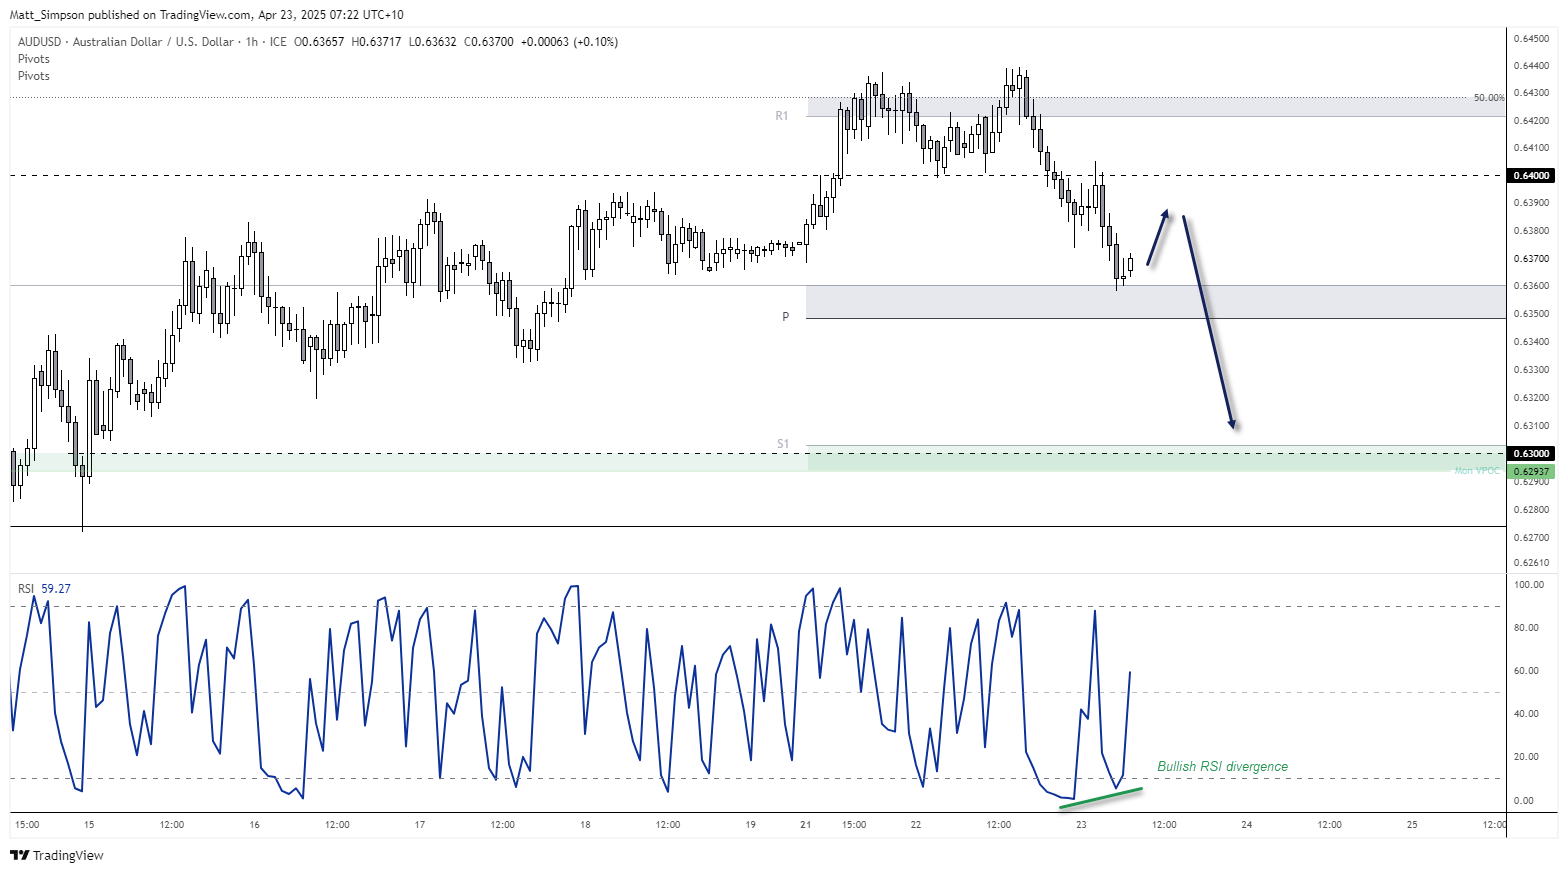
AUD/USD 1-hour chart
The Australian dollar has found support at the monthly S1 pivot point (0.6360), just above the weekly pivot point (0.6348). Given the bullish divergence on the hourly RSI (2), bears could consider fading into moves towards 0.6380 and retain a bearish bias while prices remain beneath the 0.6406 swing high, in anticipation of a break lower and a move towards 63c, near the weekly S1 pivot (0.6303) and historical weekly VPOC (0.6293).
Of course, traders should continue to keep a close eye on USD/CNH as it shares a strong, inverted correlation with AUD/USD. Therefore, we’d want to see USD/CNH rise over the near term to retain confidence of a weaker AUD/USD.
Economic events in focus (AEDT)
- 09:00 – Australian flash PMIs
- 10:30 – Japanese flash PMIs
- 13:00 – New Zealand credit card spending
- 14:30 – Japanese Tertiary Activity Index
- 15:00 – Singaporean CPI
- 17:30 – Franch flash PMIs
- 17:30 – German flash PMIs
- 18:00 – EU flash PMIs
- 18:30 – UK flash PMIs
- 23:45 – US flash PMIs
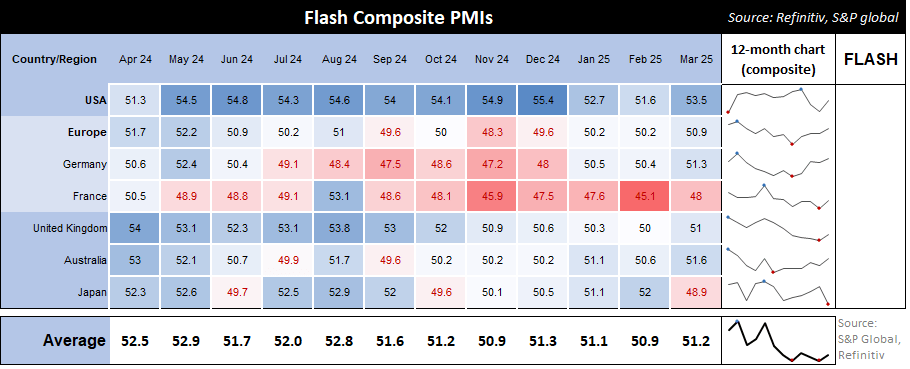
Flash PMIs are the main economic data points over the next 24 hours. Traders will keep a close eye on how inflationary measures such as ‘prices paid’ lands, as any rise here shows that inflationary pressures are building in the midst of Trump’s trade war. Should higher prices be coupled with lower headline PMIs, new orders and employment, calls for stagflation will surely mount.
-- Written by Matt Simpson
Follow Matt on Twitter @cLeverEdge
How to trade with City Index
You can trade with City Index by following these four easy steps:
- Open an account, or log in if you’re already a customer
• Open an account in the UK
• Open an account in Australia
• Open an account in Singapore
- Search for the market you want to trade in our award-winning platform
- Choose your position and size, and your stop and limit levels
- Place the trade
Related tags:


The complete CFD trading experience
Award-winning platforms, competitive spreads, low commissions and dedicated support.
We live and breathe the markets and are dedicated to helping traders realise their ambitions as we continue to set the industry bar.
Economic calendar
Web Trader platform
Our sophisticated web-based platform is packed with features.
Related articles
Nikkei swings harder than Nasdaq as AI fears deepen
Nikkei 225 volatility is running well ahead of Nasdaq 100, with the index construction and Japan's heavy exposure to AI manufacturing potentially explaining the difference.

Forex & Gold Outlook: Dollar Dominates, Crosses Diverge
The US dollar rally gathers momentum as forex crosses develop contrasting technical setups. Matt Simpson examines eight FX markets and gold for potential trading opportunities.

Gold Outlook: Asia Buys the Dip, US Hammers the Rip
Asia buys the dip, the US sells the rip. Hourly gold, dollar and Treasury yield data reveal a regional divide that has become especially pronounced since September.
StoneX Europe Ltd may make third party material available on this website which may contain information included but not limited to the conditions of financial markets. The material is for information purposes only and does not contain, and should not be construed as containing, investment advice and/or investment recommendation and/or an investment research and/or an offer of or solicitation for any transactions in financial instruments; any decision to enter into a specific transaction shall be made by the client following an assessment by him/her of their situation.
StoneX Europe Ltd makes no representation or warranty and assumes no liability as to the accuracy or completeness of the information provided, nor any loss arising from any investment based on a recommendation, forecast or other information supplied. You should always seek independent advice as to your suitability to speculate in any related markets and your ability to assume the associated risks, if you are at all unsure. We are not under any obligation to update any such material. Any opinion made may be personal to the author and may not reflect the opinion of StoneX Europe Ltd.