





AUD/USD weekly outlook: The Battler Stages a V-Bottom Recovery
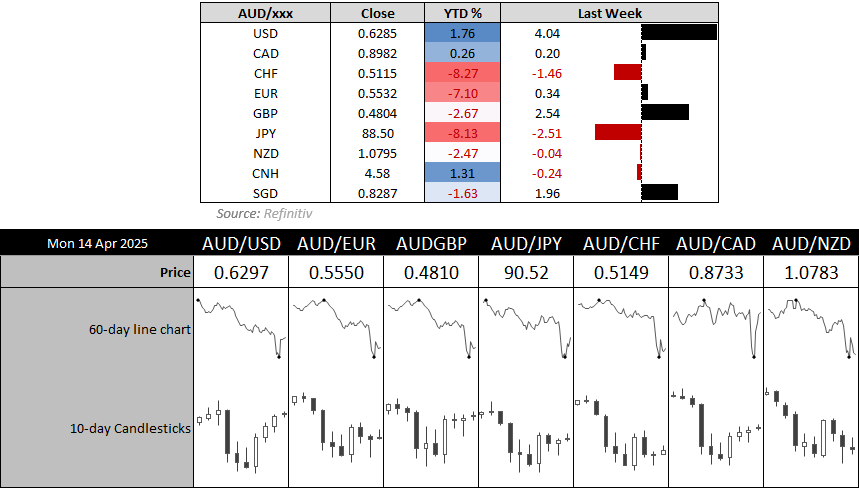
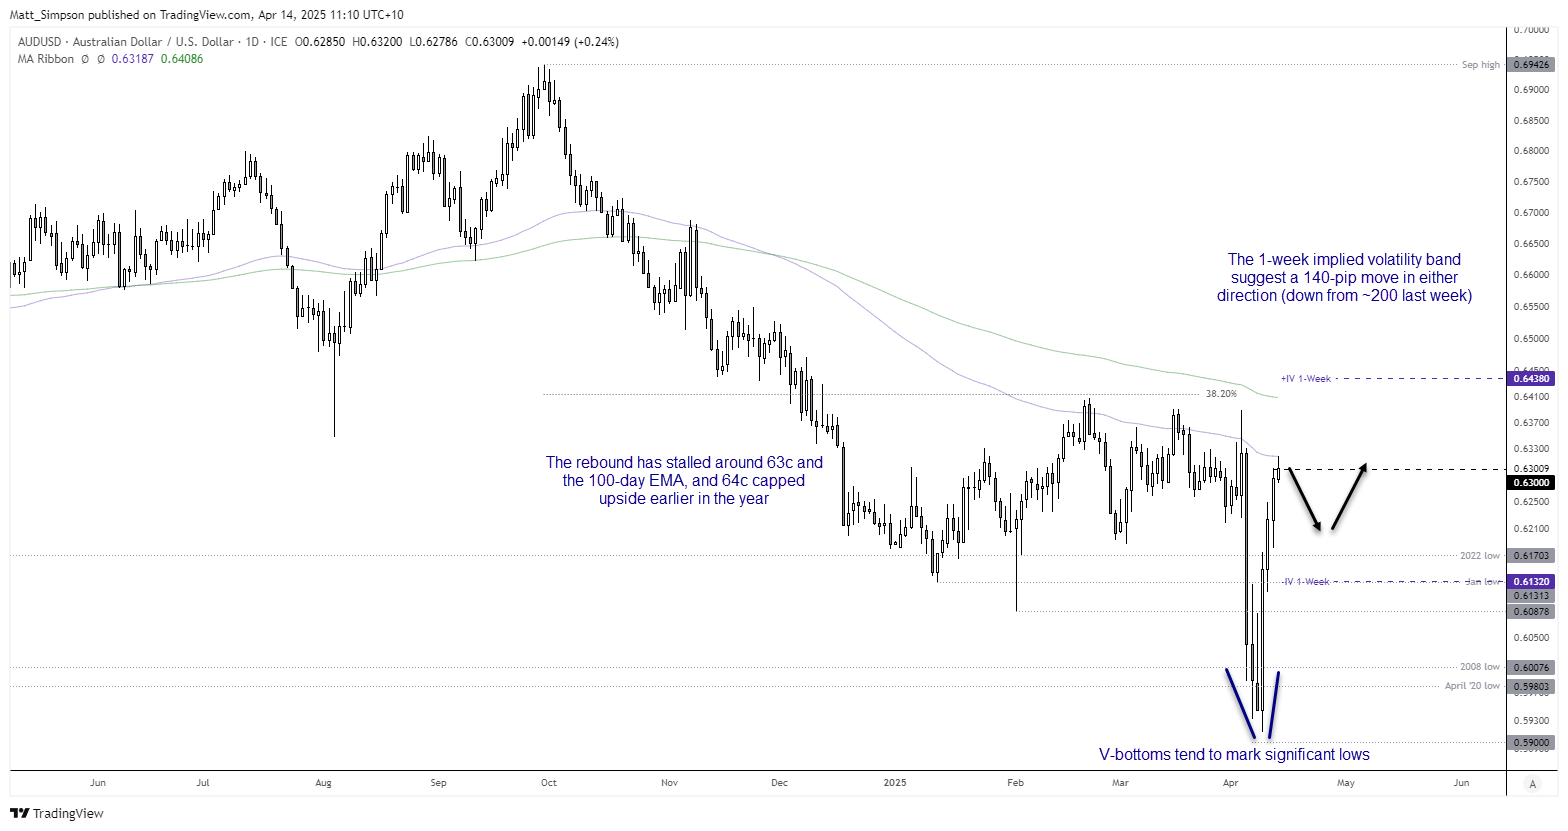
The Australian dollar posted a strong recovery, after coming precariously close to testing the 59c last week. And that has left an apparent v-bottom on the AUD/USD chart, a pattern usually associated with significant lows.
Share this:

View related analysis:
- USD/CHF Hurled Overboard, Swiss Franc, Gold Remain Supreme
- CHF Beats Yen for Safety as Tariffs Take Second Quarter to the Slaughter
- AUD/USD, Nasdaq Soar as Trump Blinks First, Sparking Epic Market U-Turn
- AUD/USD Analysis: Eyes on China and the yuan Amid Trump’s 104% Tariff
Last week serves as a fine example that volatility can cut both ways. The Australian dollar staged a strong rally from Wednesday’s low, having fallen to just 13 pips above the 59-cent handle. By the week’s close, AUD/USD had fully reversed all of the prior week’s losses and was actually up 0.8% for the month—despite April’s 8% high-to-low range making it the most volatile month since November 2022.
An interesting fact from Q1: the open-to-close range on AUD/USD was a mere 60 pips, or just 18.8% of the 320-pip total range. In contrast, we’ve already seen a 476-pip range in the first two weeks of Q2. Famous last words, but I suspect the worst of the volatility is behind us, given there’s little room left for surprises—especially regarding Trump’s tariffs.
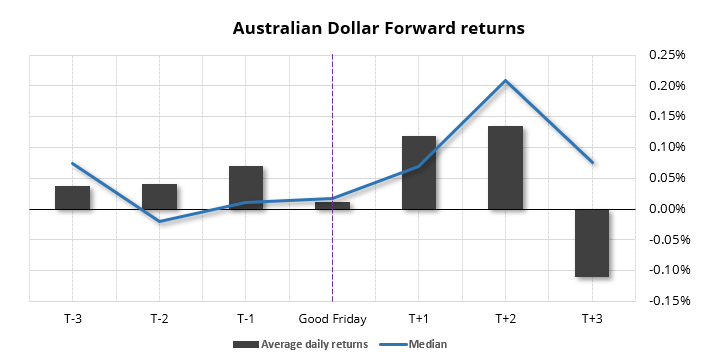
AUD/USD forward returns - Easter:
This is also a shorter week due to Easter, with Good Friday typically seeing smaller ranges because of reduced liquidity and thin trading.
The Australian dollar has averaged positive returns the three day prior to Good Friday. It has also posted a slightly positive return on Good Friday, and the Monday and Tuesday after it. Only the following Wednesday (T+3) has posted a negative average return. However, if we look at median returns, the prior Wednesday (T-2) is the only negative return.
However, whether this pattern is allowed to play out this year is debatable, given Trump’s trade war has dominated sentiment these past couple of weeks.
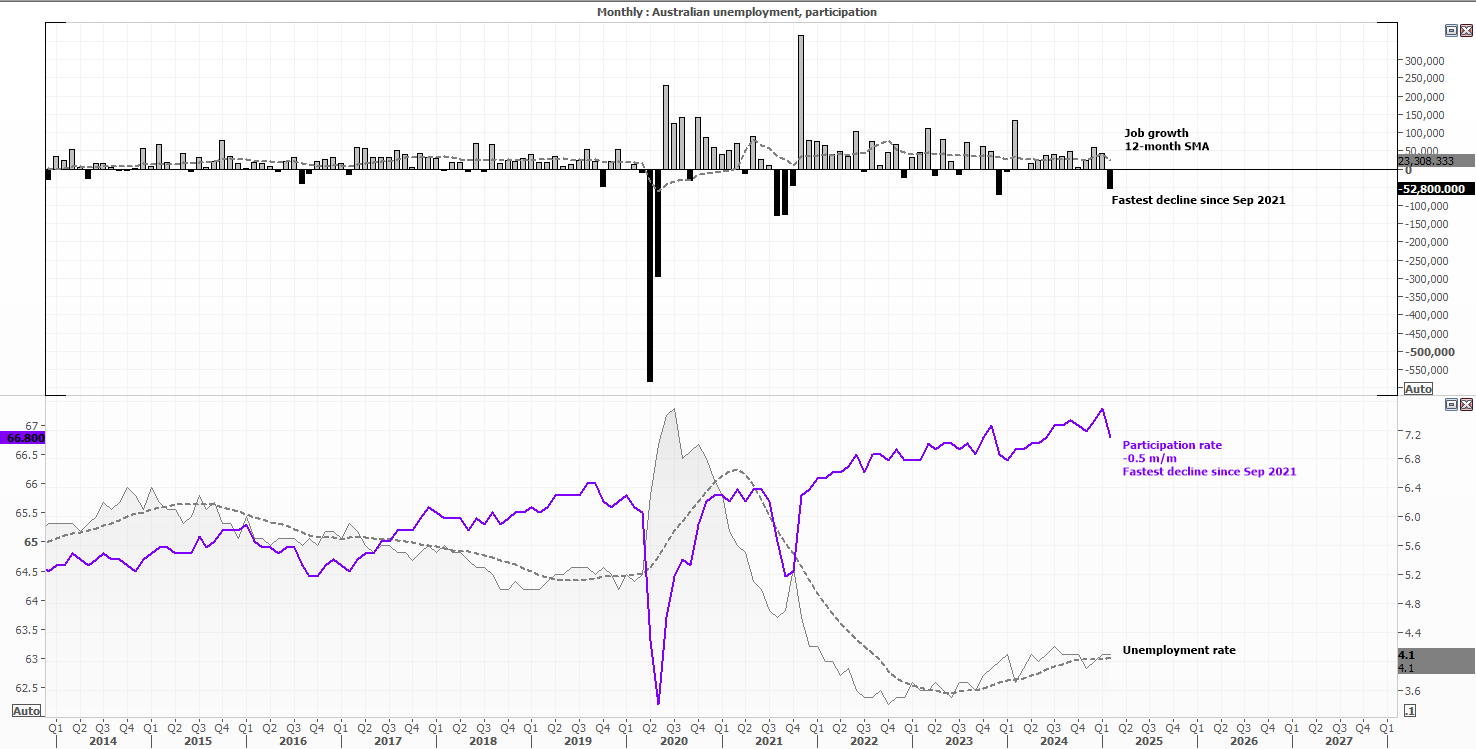
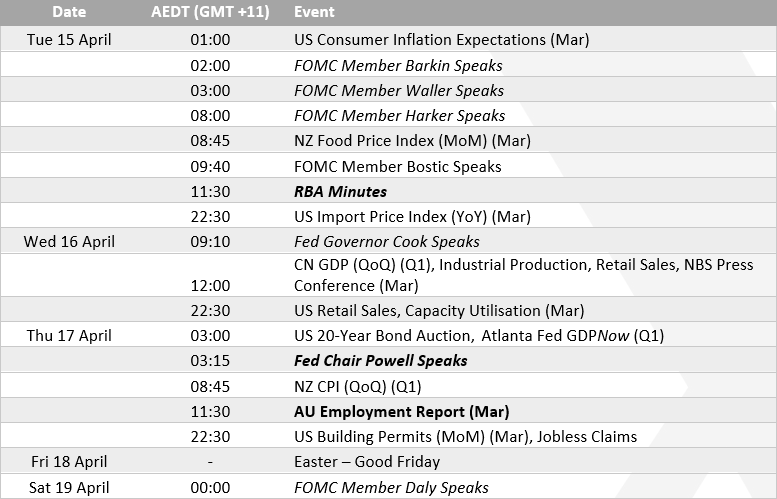
Australia’s surprise loss of 52k jobs was its fastest pace of contraction since December 2023, and the 0.5 percentage point decline was the fastest since September 2021. However, this was due to a lot of retirees dropping out of the workforce. It therefor seems reasonable to expect a rebound in this week’s employment report, released on Thursday.
Consumer sentiment fell 6% in March according to the Westpac-Melbourne Institute survey. All five sub-indices (which cover family finances, economic conditions and ‘time to buy a major household item’) were also lower, with tariffs being a major factor behind the deterioration of sentiment.
I’m not sure we’ll glean too much more from the RBA minutes, as it really comes down to the quarterly inflation figures released on April 30 as to whether the RBA could cut in May or July. And I suspect a cut in May would reduce odds of a cut in July anyway. Unless we see another weak set of employment figures this week.
Jerome Powell speaks on the US economic outlook before the Economic Club of Chicago on Wednesday (local time), or 03:15 Thursday morning Sydney time. Traders are likely to pay close attention to his remarks, for clues around potential cuts. But the Fed have been quite consistent with their desire to see how tariffs play out before committing to cuts. Bloomberg pricing currently estimates a 87% chance of a 25bp cut in June.
AUD/USD futures – market positioning from the COT report:
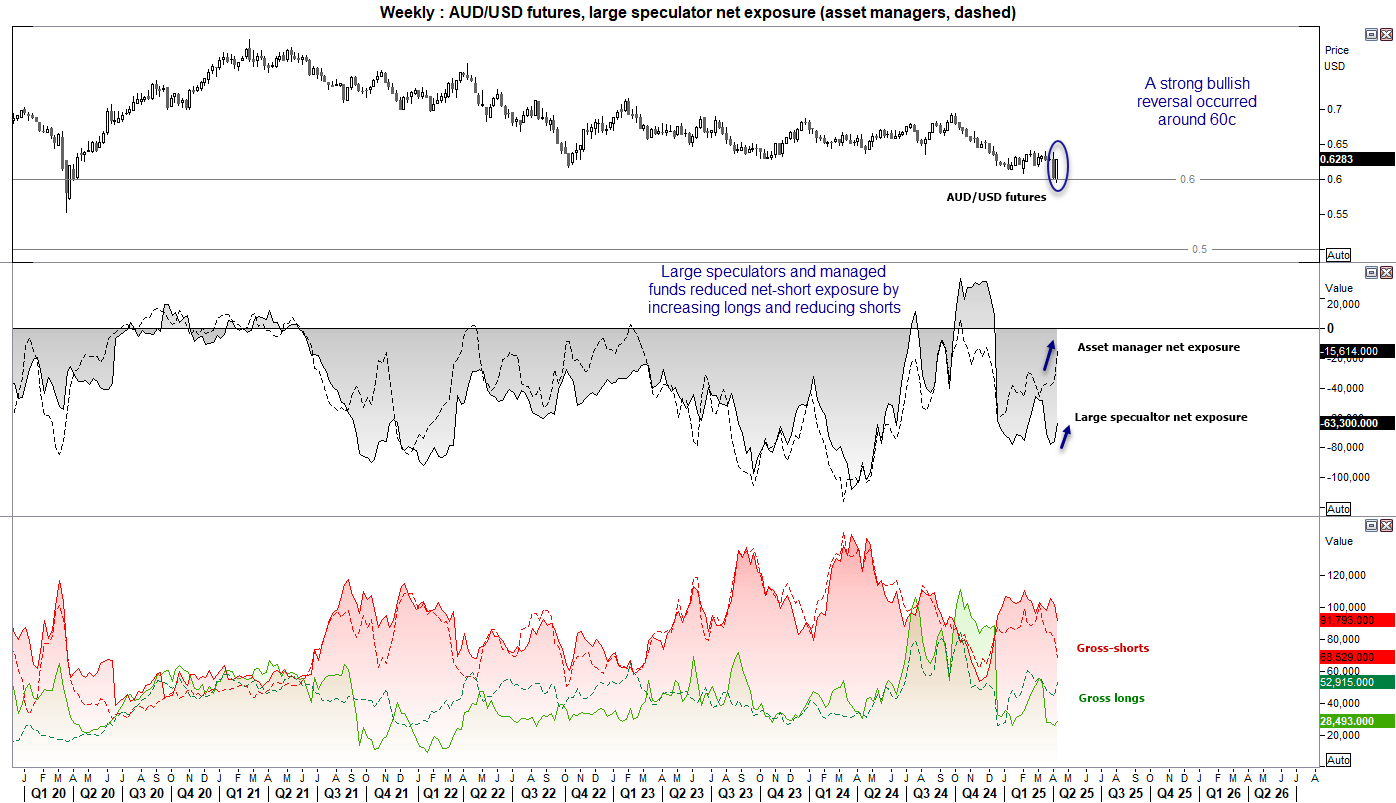
- Large speculators and managed funds decreased net-short exposure last week by a combined 32.3k contracts
- The 13k (-10%) short contracts closed by large speculators was the fastest pace of short-covering in 10 months, and the -11.7k closed by asset managers the fastest in nine months
- Asset managers also increased gross-longs by 8k contracts, their fastest pace in 12 weeks
- And these bets appeared to work out week, with AUD/USD forming a strong bullish reversal following a false break of 60c
AUD/USD correlations
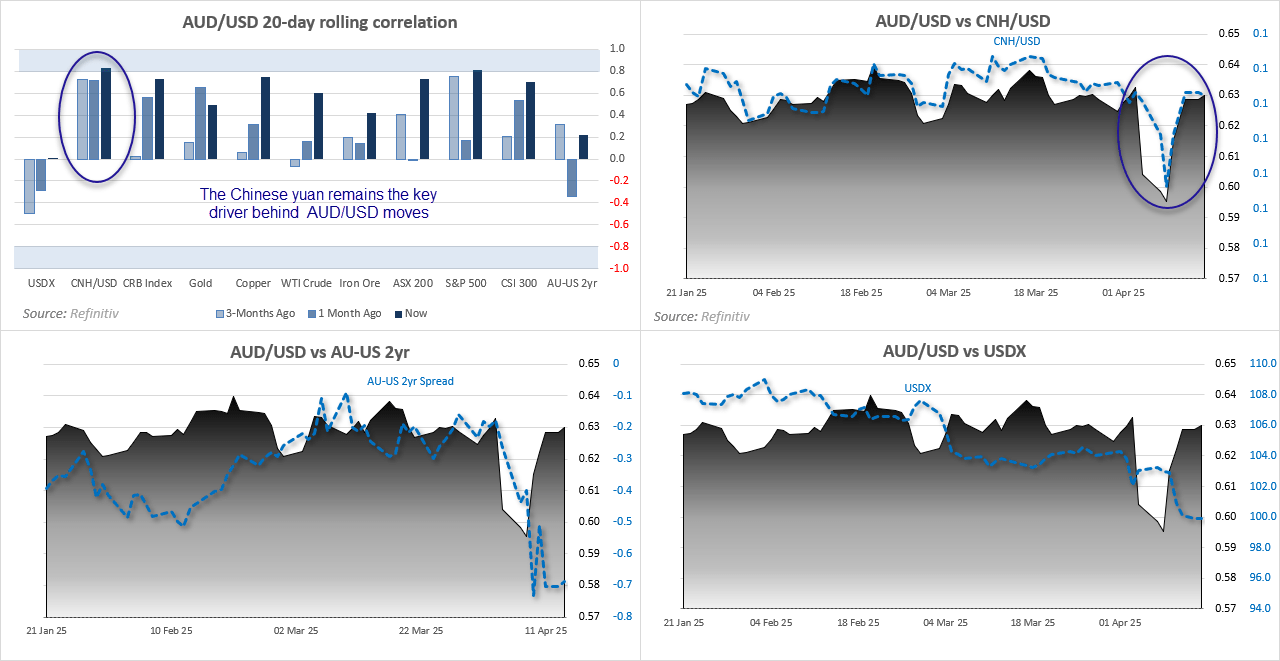
Extreme levels of volatility has seen the correlation between AUD/USD and yield differentials break down. In fact, the only strong correlation that remains in place is with the Chinese yuan (CNY). AUD/USD fell into the 50-60c range when it looked like Beijing were going to depreciate their currency, yet with USD/CNH falling from 7.43 to 7.28, AUD/USD has been allowed to fully recoup April’s early losses.
AUD/USD technical analysis
The strong recovery on AUD/USD of the past three days marks a v-bottom, which tends to occur at significant lows. With futures traders reducing short bets in exchange for longs, and Beijing showing no appetite to weaken their currency, it seems AUD/USD is poised to remain above 60c for now.
However, the rally has stalled around 63c, with today’s high perfectly respecting the 100-day EMA as resistance. Also note that 64c was a level that AUD/USD repeatedly failed to conquer in Q1. Therefore I suspect we’ve seen the baulk of AUD/USD rebound, which could keep upside limited. I therefore do not have a strong conviction this week for AUD/USD, other than seeking setups on intraday timeframes – potentially fading into resistance or waiting for bullish setups around support.
The 1-week implied volatility band allows for a 140-pip move in either direction, which is down from the 400-pip range implied last week.
-- Written by Matt Simpson
Follow Matt on Twitter @cLeverEdge
How to trade with City Index
You can trade with City Index by following these four easy steps:
- Open an account, or log in if you’re already a customer
• Open an account in the UK
• Open an account in Australia
• Open an account in Singapore
- Search for the market you want to trade in our award-winning platform
- Choose your position and size, and your stop and limit levels
- Place the trade
Latest market news




The complete CFD trading experience
Award-winning platforms, competitive spreads, low commissions and dedicated support.
We live and breathe the markets and are dedicated to helping traders realise their ambitions as we continue to set the industry bar.
Economic calendar
Web Trader platform
Our sophisticated web-based platform is packed with features.
Related articles
USD/CAD reversal risk builds as central bank showdown looms
USD/CAD has delivered a bullish reversal signal from established support, just as traders prepare for Fed and BoC decisions. Aggressive Canadian rate hike expectations and conflicting momentum signals make the coming session important.
EUR/USD weekly outlook: FOMC and ECB to set the tone
The current backdrop is modestly bearish. On Friday, the EUR/USD closed modestly lower, down for the third consecutive day. The pair also posted a weekly decline after staging a modest recovery attempt in the previous week. Out of the past 8 weeks, the EUR/USD has fallen on 6 occasions. There is not much supporting factors for the single currency right now. So, the upside remains capped.


USD/JPY Forecast: Is Rising Japanese Inflation Supporting the Yen?
As the trading week comes to an end, one of the most relevant developments in the FX market has been the renewed strength of the Japanese yen. This can be seen in the recent performance of USD/JPY, which has fallen nearly 1.0% over the last two trading sessions, highlighting a meaningful recovery in the Japanese currency against the U.S. dollar.

StoneX Europe Ltd may make third party material available on this website which may contain information included but not limited to the conditions of financial markets. The material is for information purposes only and does not contain, and should not be construed as containing, investment advice and/or investment recommendation and/or an investment research and/or an offer of or solicitation for any transactions in financial instruments; any decision to enter into a specific transaction shall be made by the client following an assessment by him/her of their situation.
StoneX Europe Ltd makes no representation or warranty and assumes no liability as to the accuracy or completeness of the information provided, nor any loss arising from any investment based on a recommendation, forecast or other information supplied. You should always seek independent advice as to your suitability to speculate in any related markets and your ability to assume the associated risks, if you are at all unsure. We are not under any obligation to update any such material. Any opinion made may be personal to the author and may not reflect the opinion of StoneX Europe Ltd.