



Australian Dollar Outlook: AUD/USD Shows Early Signs of a Swing Low
AUD/USD is showing early signs of a swing low as US dollar momentum fades, while futures positioning, options markets and technicals point to bounce risks.
Share this:

AUD/USD has posted its longest weekly losing streak in 17 months, yet several indicators suggest bearish momentum may be fading. While the RBA retains a tightening bias and the US dollar remains well supported, futures positioning, options markets, yield spreads and key technical levels all point to growing risks of a corrective bounce in the Australian dollar.
View related analysis:
View related analysis:
AUD/USD Outlook: Tentative Signs of a Swing Low
Data Supports RBA Tightening Bias
The latest trifecta of data for RBA policymakers supported a tightening bias without pointing to the need for an imminent rate hike. Unemployment edged up to 4.4%, employment rose by 40.3k and household spending rebounded. PMIs also improved slightly, with manufacturing rising to 51.2 while the services sector contraction eased to 49.9.
The RBA still has "work to do" on inflation, although Deputy Governor Andrew Hauser welcomed lower oil prices following reduced tensions in the Middle East.
Australia This Week: Economic Data and Events for AUD/USD Traders
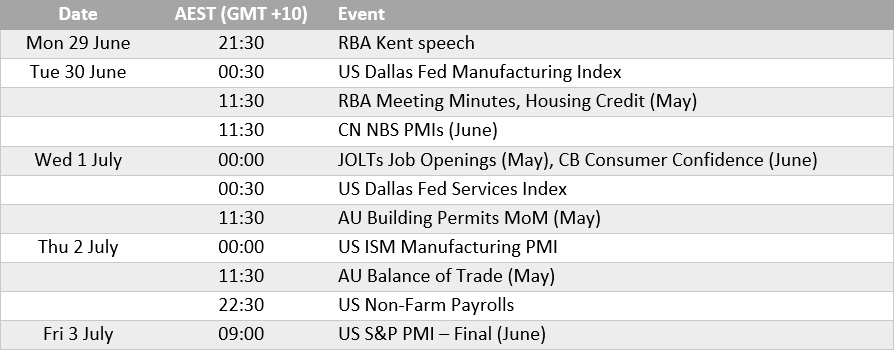
RBA Minutes in Focus
It’s not a huge week for Australian economic data, with no top-tier domestic drivers for AUD/USD drivers. Unless there are any surprises in the RBA minutes tomorrow, we may need to look to the US economic calenda of global sentiment for a directional AUD/USD cue.
We know that the RBA are likely to retain a hawkish bias, but for now can take a breather from further tightening, with one hold after three consecutive hikes. RBA cash rate futures imply a 19% chance of a hike at the next meeting, while the probability of a full hike by December sits just below 40%.
Assistant RBA Governor Christopher Kent speaks on “Additional Monetary Policy Tools: Reflections and a New Framework” at 9:30 AEST tonight. It's one to keep on the radar, although it seems unlikely to be a major market mover.
US Dollar Rally Needs Strong ISM and NFP Data to Maintain Momentum
ISM manufacturing and nonfarm payrolls are the standout events on the US economic calendar, while JOLTS job openings and the Dallas Fed manufacturing and services surveys fall into the "nice to know" category. But with traders attempting to price in further Fed hikes, and the US dollar already at a 14-month high as momentum begins to wane, dare I say the risks of disappointment are growing.
That is not to say the data will necessarily be weak, but perhaps we've reached the point where traders require even stronger data to validate the current narrative. I am therefore warming to the idea that the US dollar rally could continue to lose momentum and allow the Australian dollar room to bounce, particularly with key support levels nearby on AUD/USD and signals from the options and futures markets also pointing to at least a minor pullback.
This content was created by an affiliate of FOREX.com and represents the views and opinions of the author/speakers, not the views and opinions of FOREX.com, StoneX Group Inc., or its subsidiaries. The content has not been independently reviewed by FOREX.com.
AUD/USD Technical Analysis: Australian Dollar vs US Dollar
AUD/USD Correlations: US Dollar Dominance Returns
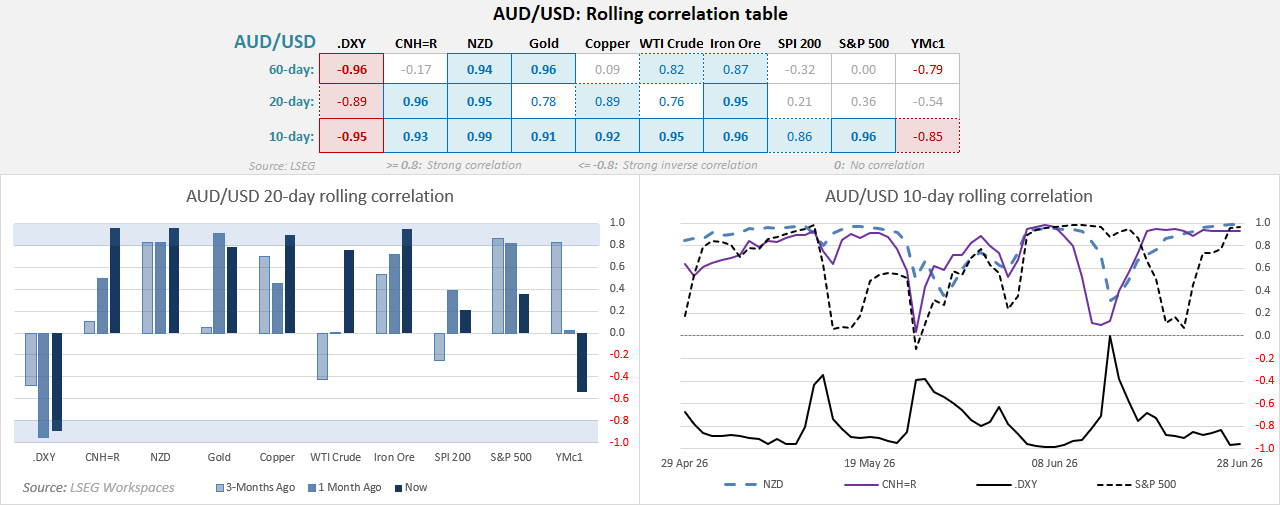
- US dollar dominance has returned, with the inverse correlation between AUD/USD and the US Dollar Index strengthening to around -0.9 or higher across the 10, 20 and 60-day timeframes.
- Familiar relationships have also re-emerged against the Chinese yuan, New Zealand dollar and gold.
- The relationship with risk appetite is also reasserting itself, with the 10-day correlation rising above 0.8 against both the S&P 500 and Nasdaq, although the 20 and 60-day readings remain in the no-correlation zone.
- The Dow Jones is the exception, with a strong negative 10-day correlation of -0.85.
Source: LSEG
AUD/USD Futures Positioning: Australian Dollar COT Report
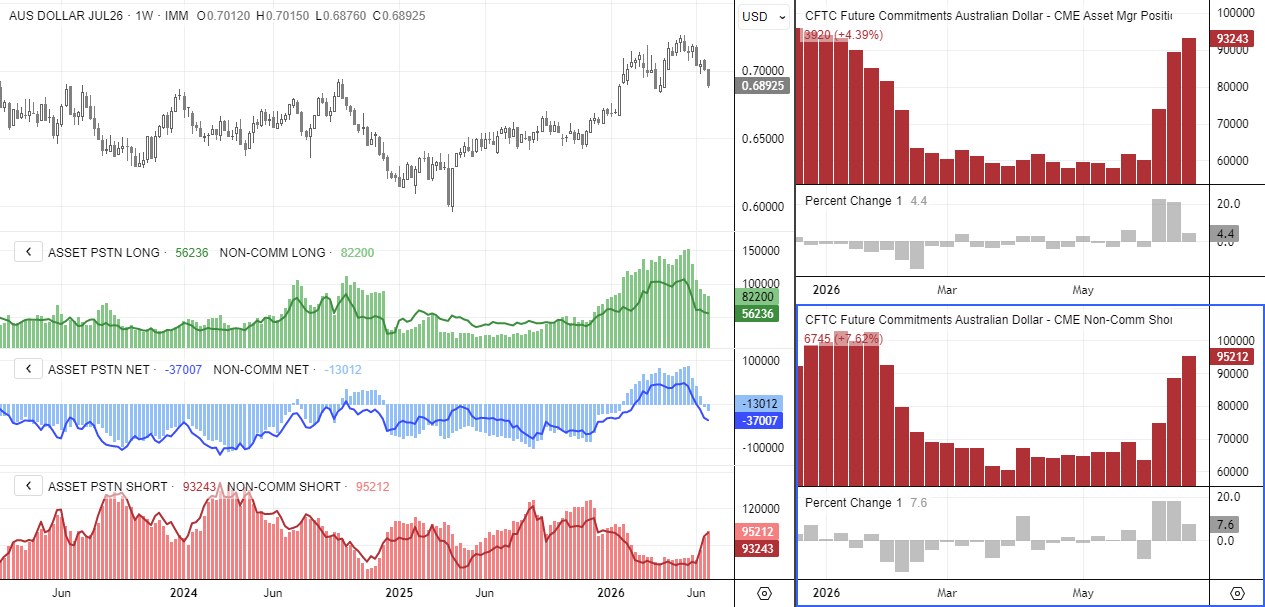
Short bets against the Australian dollar continued to rise on the futures market, although the pace of selling slowed. Large speculators increased gross shorts by 6.8k (7.4%) to a 21-week high of 95.2k contracts, while asset managers increased theirs by 3.9k (4.4%) to 93.2k. As both groups also trimmed long exposure, net shorts rose to 13k contracts for large speculators and 37k for asset managers.
While there are no immediate signs of an extreme in sentiment based on gross or net positioning, the slower pace of short accumulation could suggest downside risks for AUD/USD are becoming more limited in the near term.
Source: CFTC (COT) CME, LSEG
For traders wanting a deeper understanding of futures positioning, I’ve also published a guide on how to read and interpret weekly COT data in forex markets.
For traders wanting a deeper understanding of futures positioning, I’ve also published a guide on how to read and interpret weekly COT data in forex markets.


Australian Dollar Performance Across the FX Majors
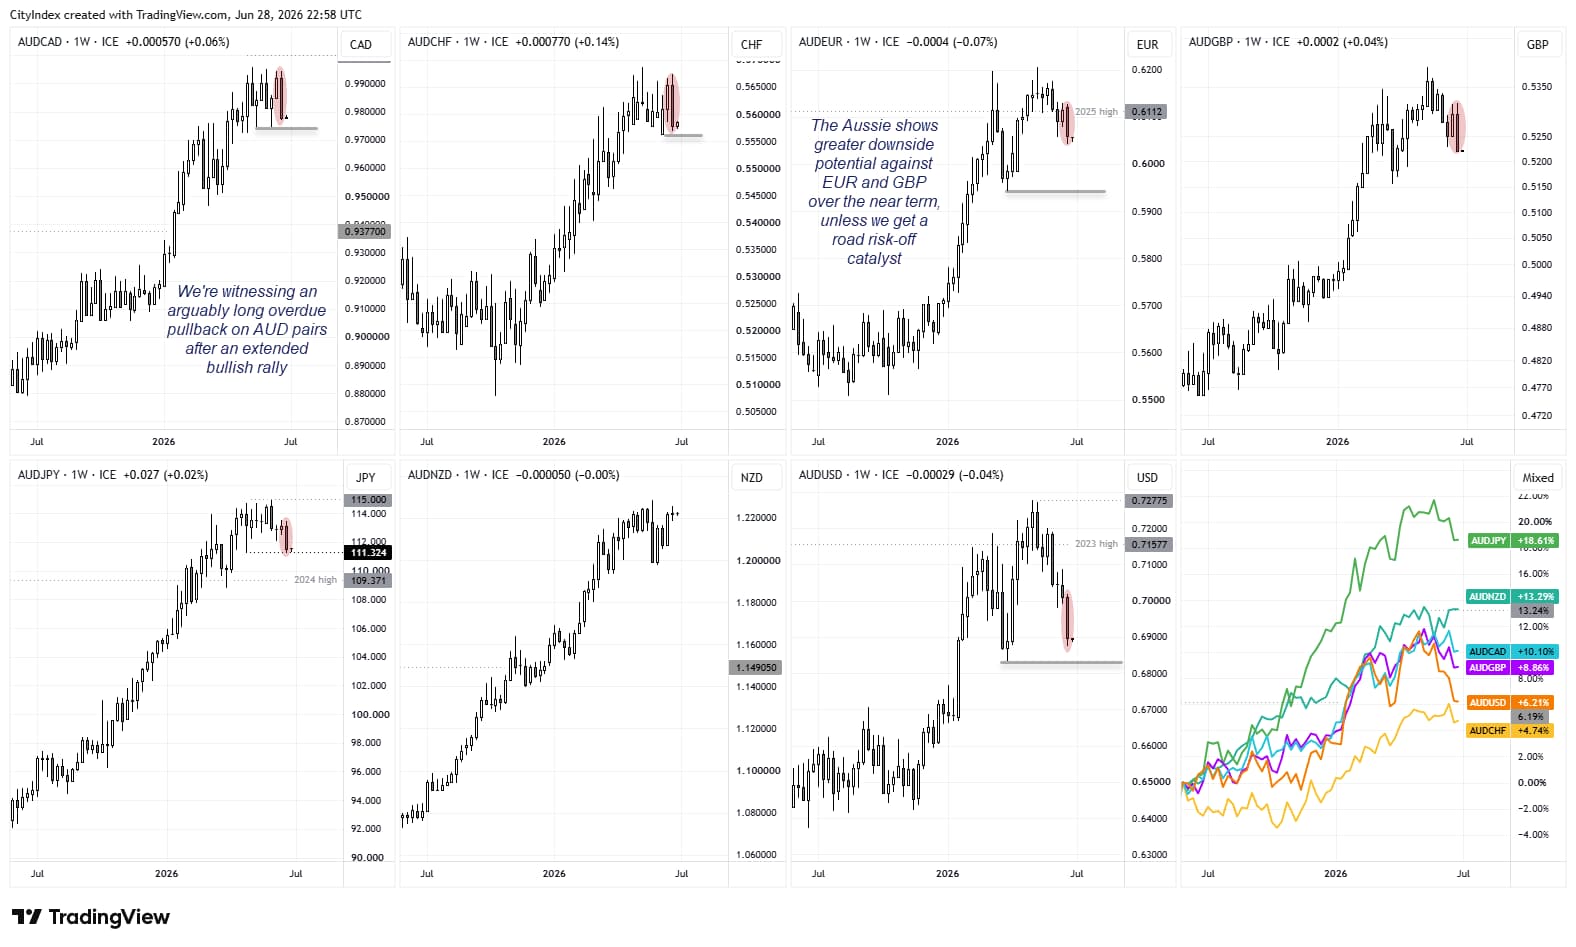
The Aussie was the second weakest FX major last week behind the New Zealand dollar. This resulted in a cluster of bearish outside and bearish engulfing candles on the weekly charts. However, that does not necessarily mean the Australian dollar will continue lower this week, and its performance could prove more mixed.
Several support levels reside nearby for AUD/USD, while AUD/NZD was effectively flat. AUD/JPY and AUD/CHF remain in strong uptrends overall, whereas AUD/EUR and AUD/GBP appear to offer the better short opportunities over the near term. Overall, these pullbacks are arguably a much-needed correction following the Australian dollar's extended rally.
Source: TradingView
AUD/USD Risk Reversals and Implied Volatility
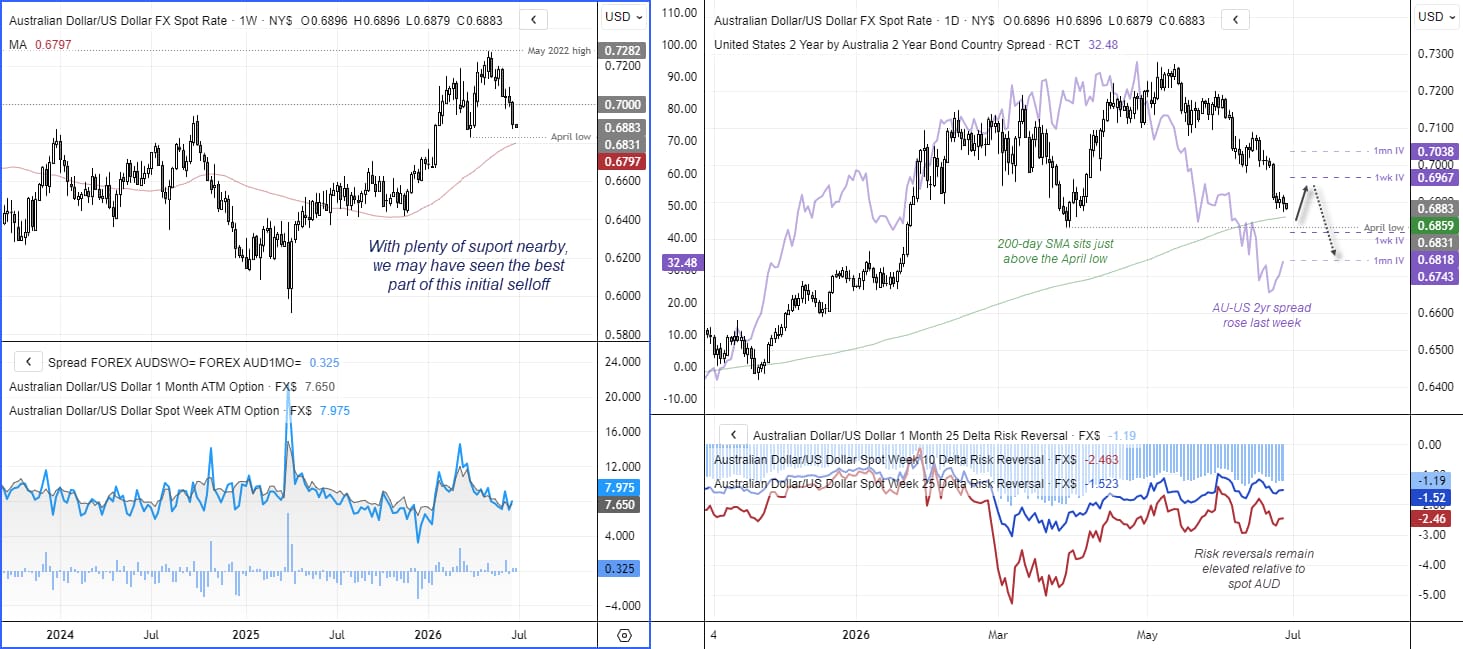
The Aussie closed lower for a fourth consecutive week, marking its most bearish streak in 17 months. Yet much of that volatility occurred on Monday, and bullish momentum on the US dollar index is also beginning to wane. With the April low (0.6831), 50-week SMA (0.6797) and 200-day SMA (0.6859) all nearby as potential support levels, I suspect we've seen the worst of this current bearish leg and that AUD/USD is becoming increasingly vulnerable to a bounce.
Furthermore, the AU-US 2-year yield spread moved higher last week. As yields have done a good job of anticipating the Australian dollar's sell-off, I am inclined to pay attention to their latest signal, which points to a potential low for AUD/USD. Notice that risk reversals also remain relatively elevated compared with Aussie spot prices, suggesting options traders are not overly concerned about additional downside for AUD/USD.
The one-week implied volatility range sits at 0.6818–0.6976, spanning just below the April low and the 11 June low. The 20-day implied volatility range sits at 0.6743–0.7038.
 Source: LSEG
View the full economic calendar
View the full economic calendar
-- Written by Matt Simpson
Follow Matt on Twitter @cLeverEdge
How to trade with City Index
You can trade with City Index by following these four easy steps:
- Open an account, or log in if you’re already a customer
• Open an account in the UK
• Open an account in Australia
• Open an account in Singapore
- Search for the market you want to trade in our award-winning platform
- Choose your position and size, and your stop and limit levels
- Place the trade



The complete CFD trading experience
Award-winning platforms, competitive spreads, low commissions and dedicated support.
We live and breathe the markets and are dedicated to helping traders realise their ambitions as we continue to set the industry bar.
Economic calendar
Web Trader platform
Our sophisticated web-based platform is packed with features.
Related articles

USD/JPY Forecast: Is Rising Japanese Inflation Supporting the Yen?
As the trading week comes to an end, one of the most relevant developments in the FX market has been the renewed strength of the Japanese yen. This can be seen in the recent performance of USD/JPY, which has fallen nearly 1.0% over the last two trading sessions, highlighting a meaningful recovery in the Japanese currency against the U.S. dollar.


Australian Dollar Forecast: AUD/USD Support Reversal Sparks Monthly Range Breakout 10 23 2026
A sharp reversal off key support has fueled the AUD/USD recovery, with resistance now in focus ahead of next week’s Fed decision and Australian CPI.


USD/JPY, Nikkei Break Lower as AI Meltdown Spreads
Thursday’s tech tantrum has become Friday’s fire sale. With Nikkei support giving way and the yen strengthening, could the selling start feeding on itself?

StoneX Europe Ltd may make third party material available on this website which may contain information included but not limited to the conditions of financial markets. The material is for information purposes only and does not contain, and should not be construed as containing, investment advice and/or investment recommendation and/or an investment research and/or an offer of or solicitation for any transactions in financial instruments; any decision to enter into a specific transaction shall be made by the client following an assessment by him/her of their situation.
StoneX Europe Ltd makes no representation or warranty and assumes no liability as to the accuracy or completeness of the information provided, nor any loss arising from any investment based on a recommendation, forecast or other information supplied. You should always seek independent advice as to your suitability to speculate in any related markets and your ability to assume the associated risks, if you are at all unsure. We are not under any obligation to update any such material. Any opinion made may be personal to the author and may not reflect the opinion of StoneX Europe Ltd.