



Canadian CPI lower than expected. Are the BOC rate hikes working?
CPI for August out of Canada was lower than expected. As a result, EUR/CAD is trading higher on the day.
Share this:

Canada’s August CPI released earlier today was 7% YoY vs an estimate of 7.3% YoY and a July reading of 7.6% YoY. This was the lowest reading since April after CPI peaked in June at 8.1%. The core CPI print was 5.8% YoY vs an expectation of 6.2% YoY and a prior reading of 6.1% YoY. This was also the lowest reading since April after peaking in June at 6.2% YoY. Does this mean that the Bank of Canada’s rate hikes are working? After the July meeting in which the BOC surprised markets by hiking rates 100bps, it followed up with another 75bps hike at the September meeting. That adds up to a 1.75% increase in the overnight rate in two months, bringing the current rate to 3.25%! This is the highest level since 2008! However, although the exceptional rate hikes may be working to bring down inflation, the BOC must be careful as the Canadian economy has lost 113,500 jobs over the last 3 months, with an Unemployment Rate at 5.4%, its highest level in 7 months.
Yesterday we looked at the USD/CAD from a weekly timeframe and noted all the potential resistance above. On a daily timeframe, we pointed out the inverted hammer. However, with today’s weaker CPI data from Canada, there has been no follow through on the downside…yet. The pair still must get through tomorrow’s FOMC meeting, which should set the tone for US Dollar pairs.
As for EUR/CAD, prices have been moving lower since July 21st, 2020 when they peaked at 1.5979. However, the momentum picked up steam after price broke below 1.4100 on March 2nd as it became apparent that the BOC would hike rates at a faster rate than the ECB. EUR/CAD began moving in a downward sloping channel and reached its lowest level since 2013 on August 25th at 1.2877, which was also the bottom trendline of the channel. Since then, EUR/CAD has bounced and is currently testing the top trendline of the channel and horizontal resistance near 1.3300.

Source: Tradingview, Stone X
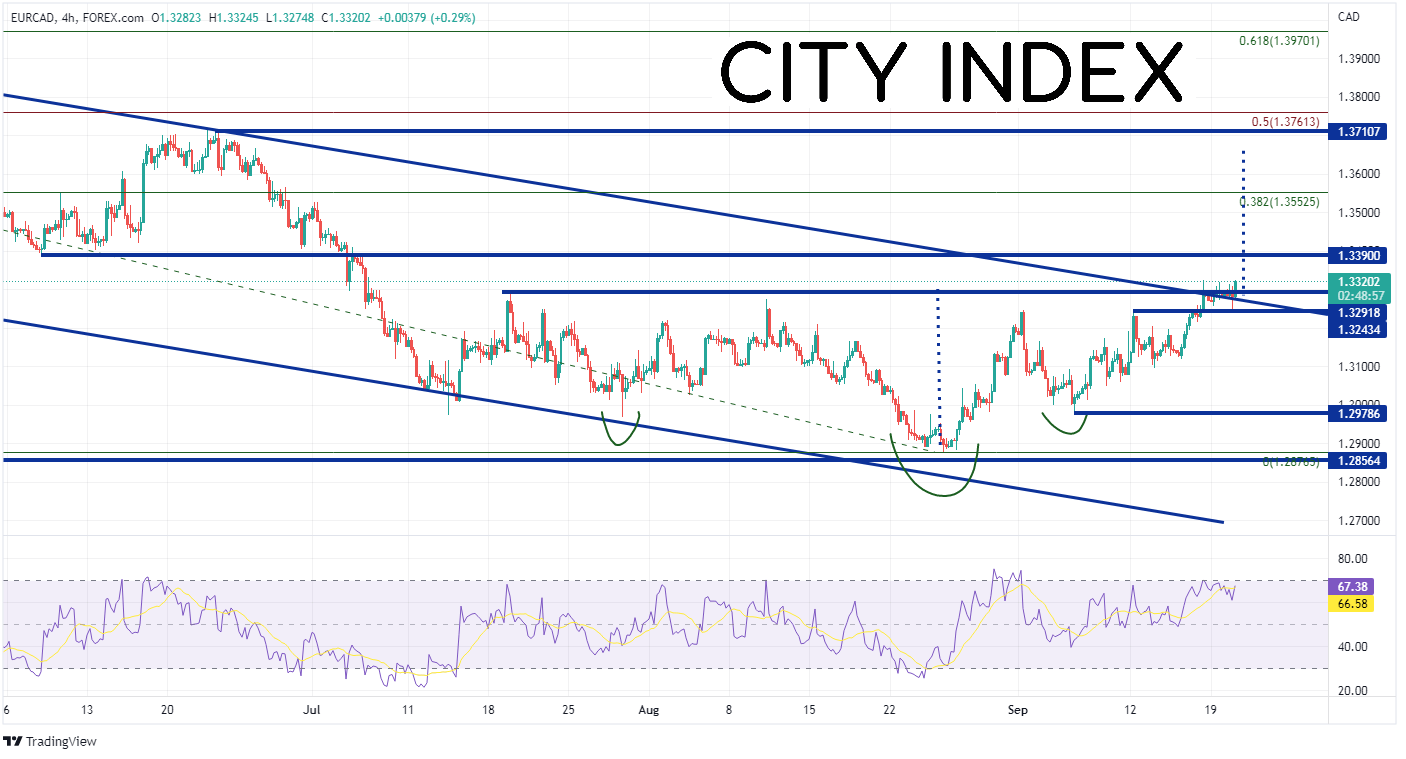
On a 240-minute timeframe, EUR/CAD appears that it may be trying to carve out an Inverted Head and Shoulders pattern. The target for this pattern is the height from the neckline to the head, added to the breakout point. In this case the target is near 1.3660. However, if price is to reach the target, it must first pass through horizontal resistance at 1.3390 and then the 38.2% Fibonacci retracement level from the highs of December 20th, 2021 to the lows of August 15th at 1.3553. Above there, horizontal resistance crosses at 1.3711. However, it this proves to be a false breakout above the channel, horizontal support crosses at 1.3292, then the lows from September 6th at 1.2979. Below there, EUR/CAD can move to the lows of August 25th at 1.2857.

Source: Tradingview, Stone X
CPI for August out of Canada was lower than expected. As a result, EUR/CAD is trading higher on the day. Will the pair continue to move higher? It may depend on the September Employment Change for Canada on October 7th. If the employment data continues to worsen, the BOC may be forced to lower the pace of interest rate increases, which could give a lift to the Canadian Dollar.
Canada’s August CPI released earlier today was 7% YoY vs an estimate of 7.3% YoY and a July reading of 7.6% YoY. This was the lowest reading since April after CPI peaked in June at 8.1%. The core CPI print was 5.8% YoY vs an expectation of 6.2% YoY and a prior reading of 6.1% YoY. This was also the lowest reading since April after peaking in June at 6.2% YoY. Does this mean that the Bank of Canada’s rate hikes are working? After the July meeting in which the BOC surprised markets by hiking rates 100bps, it followed up with another 75bps hike at the September meeting. That adds up to a 1.75% increase in the overnight rate in two months, bringing the current rate to 3.25%! This is the highest level since 2008! However, although the exceptional rate hikes may be working to bring down inflation, the BOC must be careful as the Canadian economy has lost 113,500 jobs over the last 3 months, with an Unemployment Rate at 5.4%, its highest level in 7 months.
Yesterday we looked at the USD/CAD from a weekly timeframe and noted all the potential resistance above. On a daily timeframe, we pointed out the inverted hammer. However, with today’s weaker CPI data from Canada, there has been no follow through on the downside…yet. The pair still must get through tomorrow’s FOMC meeting, which should set the tone for US Dollar pairs.
Everything you need to know about the Federal Reserve
As for EUR/CAD, prices have been moving lower since July 21st, 2020 when they peaked at 1.5979. However, the momentum picked up steam after price broke below 1.4100 on March 2nd as it became apparent that the BOC would hike rates at a faster rate than the ECB. EUR/CAD began moving in a downward sloping channel and reached its lowest level since 2013 on August 25th at 1.2877, which was also the bottom trendline of the channel. Since then, EUR/CAD has bounced and is currently testing the top trendline of the channel and horizontal resistance near 1.3300.

Source: Tradingview, Stone X
Trade EUR/CAD now: Login or Open a new account!
• Open an account in the UK
• Open an account in Australia
• Open an account in Singapore
On a 240-minute timeframe, EUR/CAD appears that it may be trying to carve out an Inverted Head and Shoulders pattern. The target for this pattern is the height from the neckline to the head, added to the breakout point. In this case the target is near 1.3660. However, if price is to reach the target, it must first pass through horizontal resistance at 1.3390 and then the 38.2% Fibonacci retracement level from the highs of December 20th, 2021 to the lows of August 15th at 1.3553. Above there, horizontal resistance crosses at 1.3711. However, it this proves to be a false breakout above the channel, horizontal support crosses at 1.3292, then the lows from September 6th at 1.2979. Below there, EUR/CAD can move to the lows of August 25th at 1.2857.
Source: Tradingview, Stone X
CPI for August out of Canada was lower than expected. As a result, EUR/CAD is trading higher on the day. Will the pair continue to move higher? It may depend on the September Employment Change for Canada on October 7th. If the employment data continues to worsen, the BOC may be forced to lower the pace of interest rate increases, which could give a lift to the Canadian Dollar.
Learn more about forex trading opportunities.
Related tags:
Latest market news




The complete CFD trading experience
Award-winning platforms, competitive spreads, low commissions and dedicated support.
We live and breathe the markets and are dedicated to helping traders realise their ambitions as we continue to set the industry bar.
Economic calendar
Web Trader platform
Our sophisticated web-based platform is packed with features.
Related articles
EUR/USD weekly outlook: FOMC and ECB to set the tone
The current backdrop is modestly bearish. On Friday, the EUR/USD closed modestly lower, down for the third consecutive day. The pair also posted a weekly decline after staging a modest recovery attempt in the previous week. Out of the past 8 weeks, the EUR/USD has fallen on 6 occasions. There is not much supporting factors for the single currency right now. So, the upside remains capped.

USD/JPY Forecast: Is Rising Japanese Inflation Supporting the Yen?
As the trading week comes to an end, one of the most relevant developments in the FX market has been the renewed strength of the Japanese yen. This can be seen in the recent performance of USD/JPY, which has fallen nearly 1.0% over the last two trading sessions, highlighting a meaningful recovery in the Japanese currency against the U.S. dollar.


Silver forecast: metals liquidation drags XAG/USD into $50-55 support
Silver has broken its July low and slipped into a long-term support zone as the selling in precious metals deepens. The chart shows where the metal could bottom, and next week's Fed decision may decide whether it does.
StoneX Europe Ltd may make third party material available on this website which may contain information included but not limited to the conditions of financial markets. The material is for information purposes only and does not contain, and should not be construed as containing, investment advice and/or investment recommendation and/or an investment research and/or an offer of or solicitation for any transactions in financial instruments; any decision to enter into a specific transaction shall be made by the client following an assessment by him/her of their situation.
StoneX Europe Ltd makes no representation or warranty and assumes no liability as to the accuracy or completeness of the information provided, nor any loss arising from any investment based on a recommendation, forecast or other information supplied. You should always seek independent advice as to your suitability to speculate in any related markets and your ability to assume the associated risks, if you are at all unsure. We are not under any obligation to update any such material. Any opinion made may be personal to the author and may not reflect the opinion of StoneX Europe Ltd.