




Canadian Dollar Forecast: USD/CAD Rally Slammed by Sellers
USD/CAD printed a bullish engulfing candlestick last week as shorts were squeezed around the FOMC meeting. But a dovish comment from Michelle Bowman has given sellers fresh motivation to start this week.
Share this:

Canadian Dollar, USD/CAD Talking Points:
- USD/CAD shorts were squeezed on a USD rally late last week that held through this week’s open.
- While geopolitical risk remains which can drive USD-strength, as war tensions could be construed as an inflationary factor particularly with oil, Michelle Bowman of the FOMC opined that she was ready to cut interest rates as soon as July and that sent the US Dollar back down.
- For USD weakness scenarios, USD/CAD remains an attractive venue. But the big question at this point is whether the U.S. Dollar can continue to rally as there’s much more Fed-speak on the calendar for this week and Bowman is considered to be one of the more dovish members of the FOMC.
USD/CAD was working on a sizable rally from last Monday’s low, at one point hitting a trough-to-peak move of 1.91%. This compares to a 1.78% move in the DXY/U.S. Dollar basket over the same period of time, illustrating the effect of an oversold short squeeze in USD/CAD.
This sent the pair up to an important level at 1.3750, which is both a psychological level and a swing-low from early-May. We even saw bulls stretch a bit this morning coming just two pips away from the 1.3800 handle, and that’s when prices posed a strong pullback with an assist from Michelle Bowman’s comment about being ready to cut rates as early as July.
This goes against the grain of what was driving since last week’s Fed meeting, where odds for a July rate cut had sunk following the Fed’s updated projections for this year. That probability was showing at 14.5% for a cut in July and given the possibility of inflation from tariffs, as Powell had said in the press conference combined with inflation risk from geopolitical drivers from the Middle East, it made sense that the Fed may wait.
But after Michelle Bowman’s remark this morning those odds have lifted up to a current reading of 22.7% and as rate cut odds have increased, USD sellers have taken another swing in the greenback, sending USD/CAD back below that 1.3750 level.
USD/CAD Daily Chart
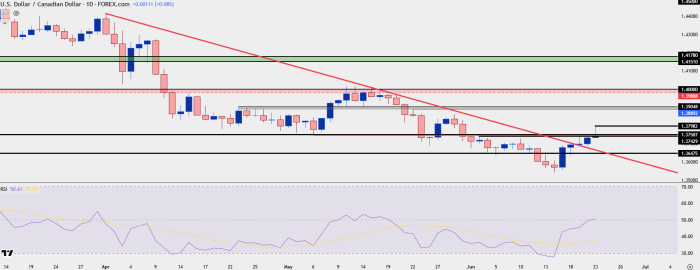
Chart prepared by James Stanley; data derived from Tradingview
USD/CAD for USD Bears
I’ve continued to say that I think USD/CAD is one of the more attractive venues for USD bears. This was a challenge early last week, however, as the USD sell-off had continued to grind and USD/CAD had moved to oversold on the daily chart via RSI as a falling wedge formation had built.
So far, that’s been defended – and from a longer-term basis the short side of the pair remains attractive as USD/CAD has pushed back into it’s almost decade-long range.
The challenge here, in my opinion, is whether USD bears can continue to forge ahead with a deeper sell-off. The pullback that we had last week is rather mild in the grander scheme and from the fundamental side, we’ll likely need to see continued push for rate cuts getting priced-in to help driver the USD-lower. In that scenario, USD/CAD remains attractive, otherwise, we may be looking at a deeper pullback as a combination of factors compel the res of the Fed, outside of Waller and Bowman, to sound a bit more-hawkish than what we’ve heard to start this week.
Notably, last week in USD/CAD produced a bullish engulfing candlestick, which will often be approached with aim of topside continuation potential. And that then draws interest to shorter-term technical levels which I’ll look at a bit lower.
USD/CAD Weekly Chart
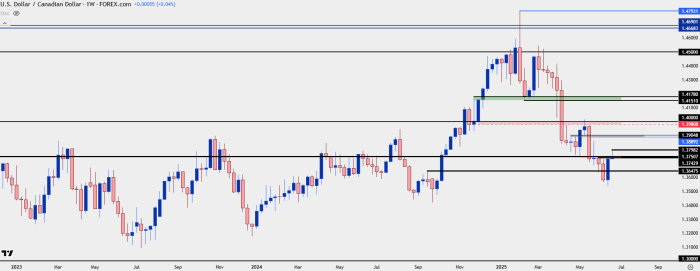
Chart prepared by James Stanley; data derived from Tradingview
USD/CAD Shorter-Term
Given that bullish engulfing candlestick on the weekly chart above, there’s also a short-term bullish trend to work with as the four-hour chart shows a sequence of higher-highs and lows after the low from last Monday.
The short-term trend pushed into overbought territory this morning, highlighting just how quickly the move came on, and also illustrating that at least a portion of that drive weas probably coming from shorts getting squeezed.
But, the big question now is whether we see buyers come in to bid higher-low support, which could further the rally into some of those longer-term levels of resistance looked at above, such as around the 1.3900 handle or perhaps even the 1.4000 level that was resistance back in May.
The prior higher-low on the four-hour chart was just inside of the 1.3700 level, and below, I’ve highlighted that recent build of bullish structure. I’ve drawn a zone around that price spanning from 1.3679 up to 1.3694, and a violation of that shows bulls losing control of the short-term move. This would also highlight the current zone that’s being tested, from 1.3743 to 1.3750, as a spot for lower-high resistance potential.
For deeper support, the 1.3648 level remains of interest as this was a spot of support-turned-resistance earlier in June, right around the time that the sell-off in USD/CAD was losing steam. If bears can take that out, I would consider that a positive illustration of sellers re-taking control of near-term trends in the pair.
USD/CAD Four-Hour Price Chart
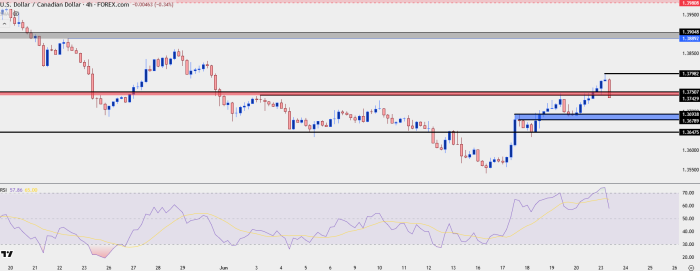
Chart prepared by James Stanley; data derived from Tradingview
--- written by James Stanley, Senior Strategist
Related tags:


The complete CFD trading experience
Award-winning platforms, competitive spreads, low commissions and dedicated support.
We live and breathe the markets and are dedicated to helping traders realise their ambitions as we continue to set the industry bar.
Economic calendar
Web Trader platform
Our sophisticated web-based platform is packed with features.
Related articles

USD/CAD forecast: rally could accelerate above June highs at 1.4250
USD/CAD recovered quickly after weaker US jobs data, keeping the bullish trend in focus. A move above the June highs could accelerate the rally as inflation keeps the Fed under pressure.


USD Sets Fresh Yearly High as EUR/USD Drops Dramatically, USD/JPY Stable
Well, it was a week of USD strength that wasn’t entirely pushed by USD/JPY, as a strong sell-off in EUR/USD has pushed the major pair to its most oversold state in a decade.

What Stretched 10-Year Yields Mean for Major Currency Pairs in Q4
U.S. 10-year Treasury yields are nearing a long-term resistance zone with overbought RSI readings, raising near-term pullback risk for the dollar.

StoneX Europe Ltd may make third party material available on this website which may contain information included but not limited to the conditions of financial markets. The material is for information purposes only and does not contain, and should not be construed as containing, investment advice and/or investment recommendation and/or an investment research and/or an offer of or solicitation for any transactions in financial instruments; any decision to enter into a specific transaction shall be made by the client following an assessment by him/her of their situation.
StoneX Europe Ltd makes no representation or warranty and assumes no liability as to the accuracy or completeness of the information provided, nor any loss arising from any investment based on a recommendation, forecast or other information supplied. You should always seek independent advice as to your suitability to speculate in any related markets and your ability to assume the associated risks, if you are at all unsure. We are not under any obligation to update any such material. Any opinion made may be personal to the author and may not reflect the opinion of StoneX Europe Ltd.