





Canadian Dollar Forecast: USD/CAD Bear Trend Falls to Fresh 2025 Lows
USD/CAD started the week with a fresh 2025 low and if we do see USD bears continue to push, the Canadian Dollar remains of interest. Next week brings BoC and employment reports from both the U.S. and Canada.
Share this:

Canadian Dollar, USD/CAD Talking Points:
- USD/CAD started the week with the print of a fresh 2025 low, and as we close the month of May the pair remains as one of the more attractive venues for USD-weakness scenarios.
- The bigger question at this point is whether US bears can continue to drive the trend as the May monthly bar is showing as an indecisive doji. For strength scenarios in the greenback, USD/CAD brings pullback potential in the broader bearish trend, and there’s likely more attractive major FX pairs to pick on for Dollar-strength, such as EUR/USD.
- I look into USD/CAD each week during the price action webinar, and you’re welcome to join the next. Click here to register.
As we near the monthly close for May a large question mark hangs around the U.S. Dollar. While the trend was decisive through March and early-April, the past six weeks have been a change-of-pace, helping to produce an indecisive candlestick on the monthly chart. While this does not preclude bearish continuation, it does bring question, as a similar show of indecision in January ushered in wide-scale change as the bullish breakout from Q4 led into a strong reversal in Q1. Those monthly dojis can be tricky as they cover a lot of headlines and a considerable span of time.
But what is perhaps less of a question is one of viability, as in if we do see USD bears continuing to driver the currency, USD/CAD remains as one of the more attractive venues for bearish continuation.
The big push point behind that drives right back to the monthly chart, where the USD/CAD pair has been range-bound now for going on a decade.
USD/CAD Monthly Chart
 Chart prepared by James Stanley; data derived from Tradingview
The big item in USD/CAD for the month of May is what bulls failed to do – and that’s run a rally above the psychological level at 1.4000 which has had some longer-term bearing on the pair. That price came in to set resistance over a week in the middle of the month, with sellers taking another step forward as they pushed down to a fresh 2025 low on Monday of this week.
That sell-off started to soften at a trendline projection, however, and that led to a morning star formation that completed on Tuesday, which I’ll look at on the daily chart a little lower in this article.
USD/CAD Weekly Price Chart
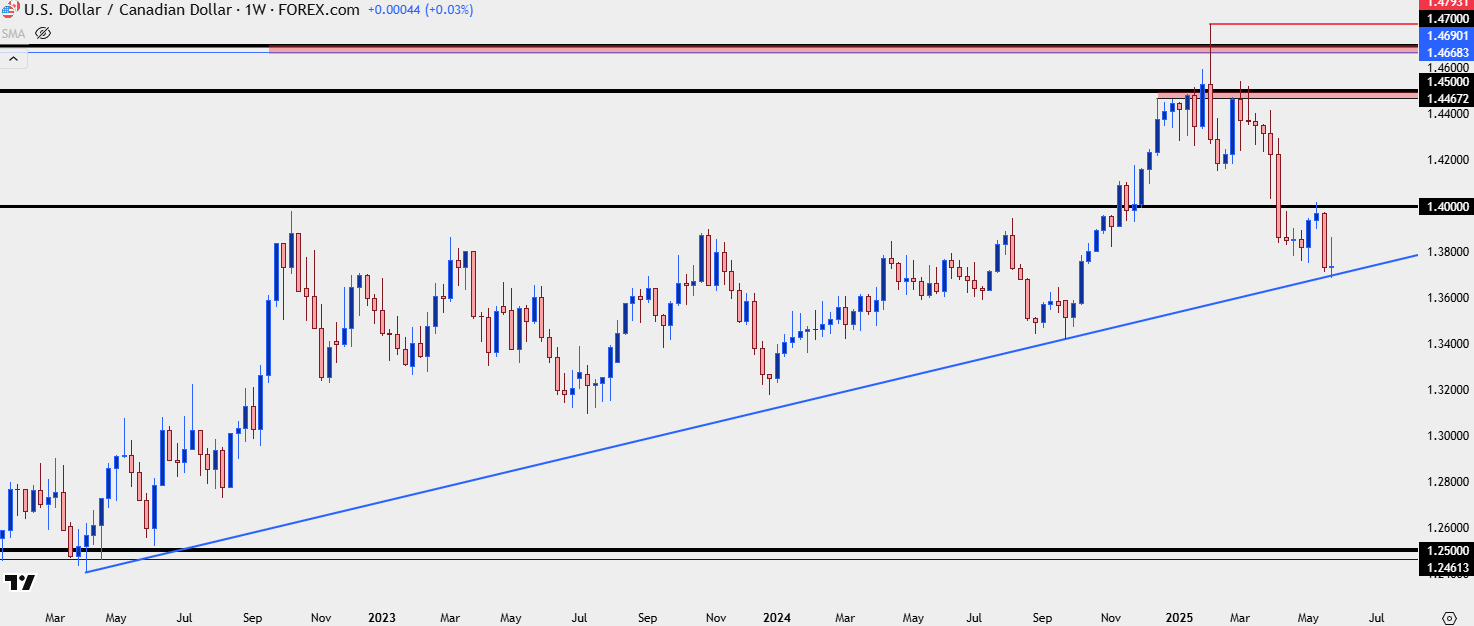 Chart prepared by James Stanley; data derived from Tradingview
From the daily chart, we can see why the pair remains of attraction for USD weakness scenarios, as USD/CAD is very close to that recently established 2025 low while the US Dollar remains a bit further away from its own 2025 low, on a relative basis. The challenge here, however, is trying to avoid chasing, and this sets up lower-high resistance potential at 1.3781 and 1.3813, after which the 1.3890-1.3905 zone comes back into the picture.
That ‘r3’ zone of resistance is confluent with the bearish trendline from the May highs towards the middle of next week, and if bulls can force a break above that, we’re likely seeing a broader move of USD-strength, which, as alluded to in the above video, could be an attractive theme in the EUR/USD pair.
For USD/CAD, that 1.4000 zone remains as an important juncture for bigger-picture themes, and if a stronger move shows behind a USD turn, then the next zone of resistance overhead is the 1.4149-1.4178 area of prior support.
USD/CAD Daily Price Chart
 Chart prepared by James Stanley; data derived from Tradingview
--- written by James Stanley, Senior Strategist
Canadian Dollar, USD/CAD Talking Points:
- USD/CAD started the week with the print of a fresh 2025 low, and as we close the month of May the pair remains as one of the more attractive venues for USD-weakness scenarios.
- The bigger question at this point is whether US bears can continue to drive the trend as the May monthly bar is showing as an indecisive doji. For strength scenarios in the greenback, USD/CAD brings pullback potential in the broader bearish trend, and there’s likely more attractive major FX pairs to pick on for Dollar-strength, such as EUR/USD.
As we near the monthly close for May a large question mark hangs around the U.S. Dollar. While the trend was decisive through March and early-April, the past six weeks have been a change-of-pace, helping to produce an indecisive candlestick on the monthly chart. While this does not preclude bearish continuation, it does bring question, as a similar show of indecision in January ushered in wide-scale change as the bullish breakout from Q4 led into a strong reversal in Q1. Those monthly dojis can be tricky as they cover a lot of headlines and a considerable span of time.
But what is perhaps less of a question is one of viability, as in if we do see USD bears continuing to driver the currency, USD/CAD remains as one of the more attractive venues for bearish continuation.
The big push point behind that drives right back to the monthly chart, where the USD/CAD pair has been range-bound now for going on a decade.
USD/CAD Monthly Chart
Chart prepared by James Stanley; data derived from Tradingview
The big item in USD/CAD for the month of May is what bulls failed to do – and that’s run a rally above the psychological level at 1.4000 which has had some longer-term bearing on the pair. That price came in to set resistance over a week in the middle of the month, with sellers taking another step forward as they pushed down to a fresh 2025 low on Monday of this week.
That sell-off started to soften at a trendline projection, however, and that led to a morning star formation that completed on Tuesday, which I’ll look at on the daily chart a little lower in this article.
USD/CAD Weekly Price Chart
Chart prepared by James Stanley; data derived from Tradingview
From the daily chart, we can see why the pair remains of attraction for USD weakness scenarios, as USD/CAD is very close to that recently established 2025 low while the US Dollar remains a bit further away from its own 2025 low, on a relative basis. The challenge here, however, is trying to avoid chasing, and this sets up lower-high resistance potential at 1.3781 and 1.3813, after which the 1.3890-1.3905 zone comes back into the picture.
That ‘r3’ zone of resistance is confluent with the bearish trendline from the May highs towards the middle of next week, and if bulls can force a break above that, we’re likely seeing a broader move of USD-strength, which, as alluded to in the above video, could be an attractive theme in the EUR/USD pair.
For USD/CAD, that 1.4000 zone remains as an important juncture for bigger-picture themes, and if a stronger move shows behind a USD turn, then the next zone of resistance overhead is the 1.4149-1.4178 area of prior support.
USD/CAD Daily Price Chart
Chart prepared by James Stanley; data derived from Tradingview
--- written by James Stanley, Senior Strategist


The complete CFD trading experience
Award-winning platforms, competitive spreads, low commissions and dedicated support.
We live and breathe the markets and are dedicated to helping traders realise their ambitions as we continue to set the industry bar.
Economic calendar
Web Trader platform
Our sophisticated web-based platform is packed with features.
Related articles

USD/CAD forecast: rally could accelerate above June highs at 1.4250
USD/CAD recovered quickly after weaker US jobs data, keeping the bullish trend in focus. A move above the June highs could accelerate the rally as inflation keeps the Fed under pressure.


USD Sets Fresh Yearly High as EUR/USD Drops Dramatically, USD/JPY Stable
Well, it was a week of USD strength that wasn’t entirely pushed by USD/JPY, as a strong sell-off in EUR/USD has pushed the major pair to its most oversold state in a decade.

Dow Jones Slide Shows What Rate Hike Bets Mean for Stocks
The Dow Jones support breakdown shows rising bond yields and rate hike bets hitting U.S. stocks while tech giants prop up the Nasdaq.
StoneX Europe Ltd may make third party material available on this website which may contain information included but not limited to the conditions of financial markets. The material is for information purposes only and does not contain, and should not be construed as containing, investment advice and/or investment recommendation and/or an investment research and/or an offer of or solicitation for any transactions in financial instruments; any decision to enter into a specific transaction shall be made by the client following an assessment by him/her of their situation.
StoneX Europe Ltd makes no representation or warranty and assumes no liability as to the accuracy or completeness of the information provided, nor any loss arising from any investment based on a recommendation, forecast or other information supplied. You should always seek independent advice as to your suitability to speculate in any related markets and your ability to assume the associated risks, if you are at all unsure. We are not under any obligation to update any such material. Any opinion made may be personal to the author and may not reflect the opinion of StoneX Europe Ltd.