


Canadian Dollar Forecast: USD/CAD rebounds following the NFP release
During today’s session, USD/CAD has posted a consistent gain of more than 0.5%, with price action favoring the U.S. dollar. This move has begun to establish a new short-term bullish bias within the pair’s average price movements.
Share this:

During today’s session, USD/CAD has posted a consistent gain of more than 0.5%, with price action favoring the U.S. dollar. This move has begun to establish a new short-term bullish bias within the pair’s average price movements. The renewed buying pressure emerged after the release of the U.S. Non-Farm Payrolls (NFP) data, which now suggest that the Federal Reserve could adopt a more restrictive stance. This has strengthened the U.S. dollar, causing the Canadian dollar to lose ground. If this dynamic persists, it could translate into more sustained buying pressure in USD/CAD over the coming sessions.


NFP data released in the United States
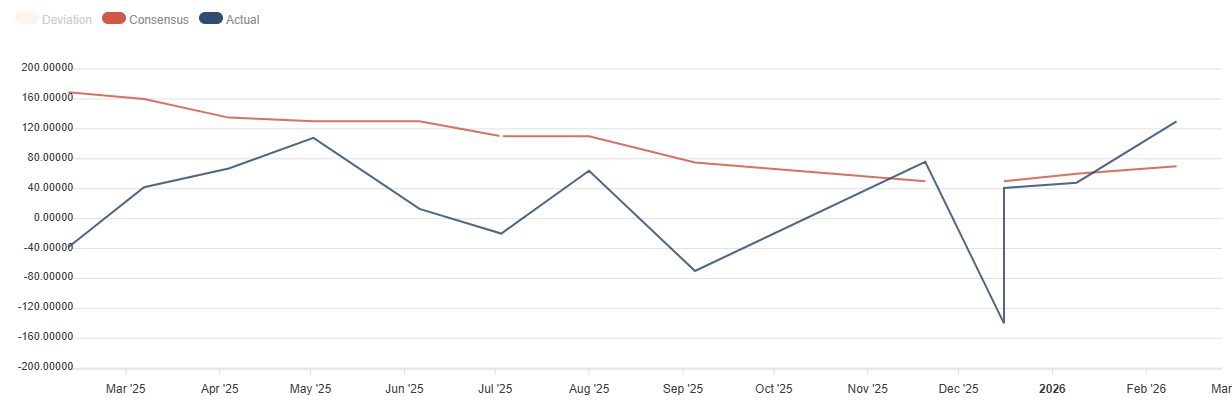
Earlier today, U.S. NFP employment data were published, and the figure surprised markets by coming in above the expected 70K jobs, posting an actual reading of 130K, also well above the previous 48K. This release not only reinforces the recovery trend observed in the average job growth over the past two months but also confirms stronger labor market momentum than anticipated for January.
Source: FXSTREET
In this context, it is important to remember that employment data are a key pillar in shaping the Federal Reserve’s outlook. As labor market conditions no longer appear to pose a significant threat to economic stability, this may open the door to a firmer stance—or at least to maintaining rates unchanged in the near term.
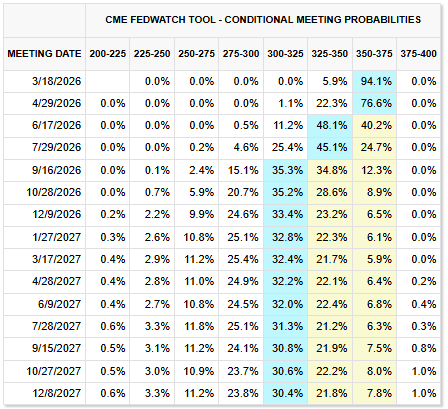
In fact, CME Group probabilities have already adjusted. Markets now assign a 94.1% probability that rates will remain at 3.75% for the March 18 meeting, and a 76.6% probability that rates will remain unchanged at the April 29 decision. This is notable considering that prior to the NFP release, probabilities were below 80% for March and below 65% for April, suggesting that markets are now pricing in a slightly more restrictive tone from the Fed.
Source: CMEGROUP
In this context, recent events help explain the renewed strength in USD/CAD. A more stable Federal Reserve outlook could help maintain consistency in bond yields—the U.S. 10-year yield has already recovered toward the 4.2% area—improving the dollar’s attractiveness and supporting demand in the short term.
As a result, the latest employment data could help restore confidence in the U.S. dollar, putting renewed pressure on the Canadian dollar. This scenario may be reinforced if upcoming inflation data confirm expectations of a firmer monetary stance, keeping buying pressure in USD/CAD relevant over the next several sessions.
USD/CAD technical Outlook
Source: StoneX, Tradingview
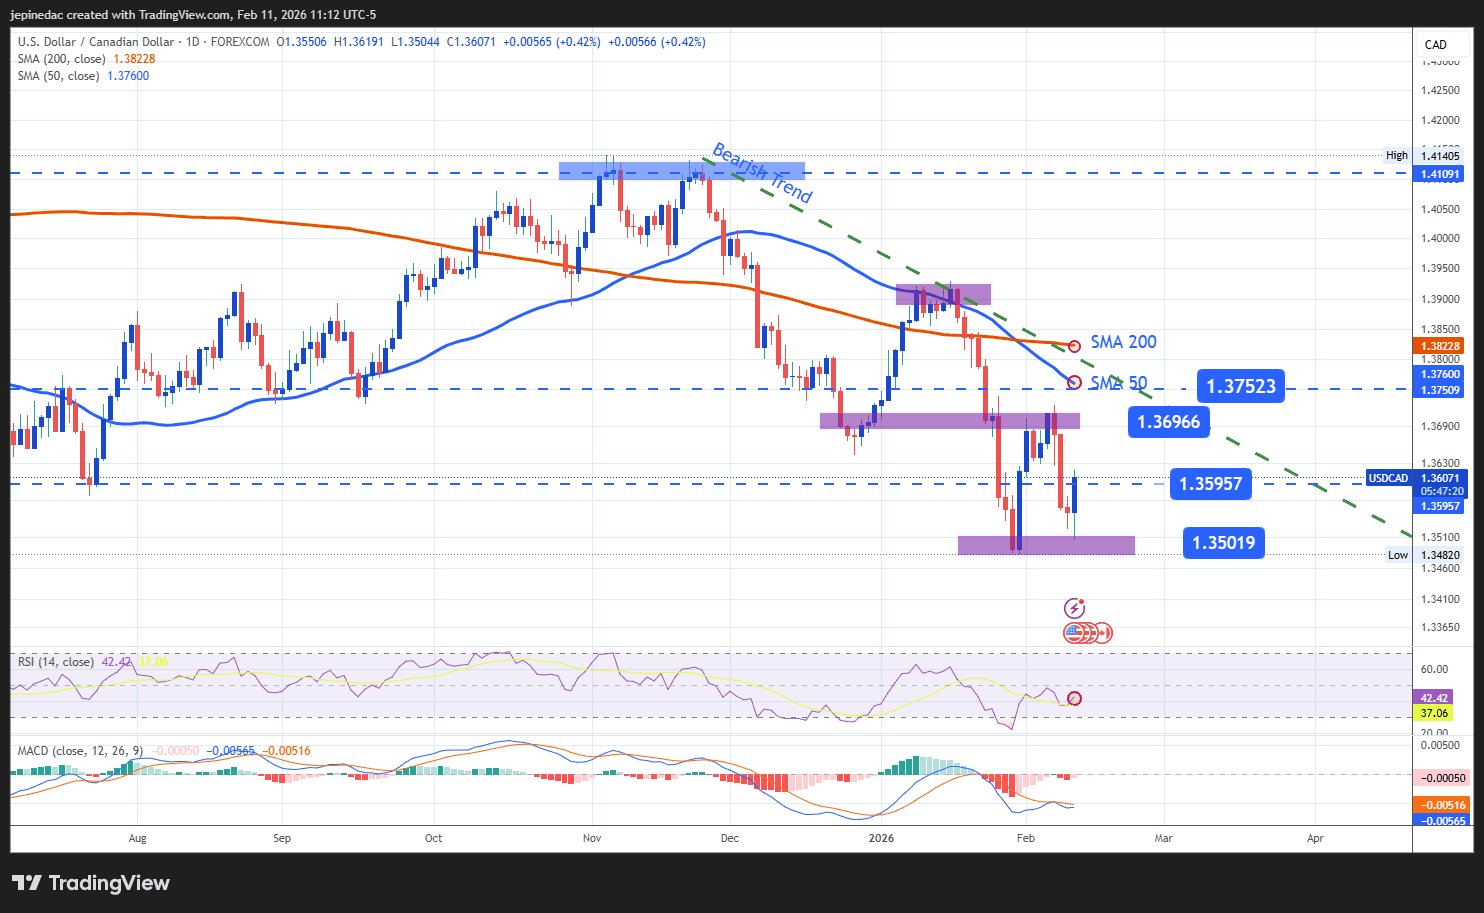
- The bearish trend remains dominant, at least for now: Since November 2025, USD/CAD price action has structured a solid downtrend, which remains the most relevant technical formation on the chart. However, the current trendline has struggled to generate new short-term lows, potentially reflecting a lack of clear direction and the beginning of a consolidation phase. If buying pressure continues to gain traction, a more defined consolidation range could begin to take shape.
- RSI: The RSI is approaching the neutral 50 level, signaling that bullish and bearish momentum over the past 14 sessions has begun to balance out. This behavior suggests a growing phase of indecision, which may influence upcoming price movements in USD/CAD.
- MACD: A similar scenario is observed in the MACD, where the histogram remains very close to the neutral zero line, indicating no clear dominance in short-term moving average momentum. This further reinforces the sense of indecision that appears to be building in the pair.
Key levels:
- 1.39966 – Key resistance: This level corresponds to recent weekly highs and lies near the prevailing downtrend line. A sustained move above this area could threaten the bearish structure and open the door to a stronger bullish bias in the short term.
- 1.35957 – Current barrier: A relevant neutrality zone aligned with significant price retracements observed in July 2025. If price action fails to move decisively away from this level, a short-term consolidation range could develop.
- 1.35019 – Crucial support: This level corresponds to recent lows and represents the main downside barrier. A sustained break below this zone could enable fresh lows, reinforcing the dominant bearish bias and potentially extending the downtrend in the weeks ahead.
Written by Julian Pineda, CFA, CMT – Market Analyst
Follow him on: @julianpineda25
Latest market news




The complete CFD trading experience
Award-winning platforms, competitive spreads, low commissions and dedicated support.
We live and breathe the markets and are dedicated to helping traders realise their ambitions as we continue to set the industry bar.
Economic calendar
Web Trader platform
Our sophisticated web-based platform is packed with features.
Related articles
US Dollar Short-term Outlook: USD Rally on the Line as Midterms, NFP Loom 11 3 2026
DXY is testing pivotal support, with the weekly range breakout likely to determine the next major leg of the trend as key event risk unfolds.

USD/JPY Analysis: Rising U.S. Yields Leave the Yen on the Defensive
As the first week of November progresses, renewed weakness in the Japanese yen is once again becoming evident in the short term. This dynamic can be seen in the recent performance of USD/JPY, which has posted two consecutive bullish sessions and gained more than 0.7%, reflecting a return of buying interest in the dollar while the yen continues to lose momentum.
Australian Dollar Technical Outlook: AUD/USD October Breakout Reverses Toward Critical Support 11 3 2026
Aussie bulls face a critical test of rising trend support, with the October recovery under threat as selling pressure builds into November.
StoneX Europe Ltd may make third party material available on this website which may contain information included but not limited to the conditions of financial markets. The material is for information purposes only and does not contain, and should not be construed as containing, investment advice and/or investment recommendation and/or an investment research and/or an offer of or solicitation for any transactions in financial instruments; any decision to enter into a specific transaction shall be made by the client following an assessment by him/her of their situation.
StoneX Europe Ltd makes no representation or warranty and assumes no liability as to the accuracy or completeness of the information provided, nor any loss arising from any investment based on a recommendation, forecast or other information supplied. You should always seek independent advice as to your suitability to speculate in any related markets and your ability to assume the associated risks, if you are at all unsure. We are not under any obligation to update any such material. Any opinion made may be personal to the author and may not reflect the opinion of StoneX Europe Ltd.