



Canadian Dollar Outlook: AUD/CAD Eyes Parity as USD/CAD Stretches Higher
Canada's inflation surprised to the upside, but stretched bearish positioning and overbought technicals suggest USD/CAD may be due a pullback while AUD/CAD continues to eye parity.
Share this:

Canada's inflation rate accelerated above the Bank of Canada's target band in May, yet markets remain convinced policymakers will leave rates unchanged. With bearish CAD positioning becoming increasingly crowded and several Canadian dollar crosses flashing signs of exhaustion, traders may be asking whether a near-term rebound in the loonie is overdue. Here is the outlook for USD/CAD, AUD/CAD and EUR/CAD ahead of the BoC's next policy decision.
View related analysis:
- Japanese Yen Outlook: Are USD/JPY Bulls Right to Ignore MOF Intervention Risk?
- ASX 200 Outlook: A Bounce Is Brewing, But Data Risk Looms
- US Dollar Longs Surge, Yen Shorts Hit Record High | COT Report
- Australian Dollar Outlook: AU and US Inflation Test AUD/USD Resilience
- How to Read the COT Report to Track Forex Market Sentiment
Canadian Dollar Outlook: Stretched Positioning Meets Key Technical Levels
Headline Inflation Jumps on Higher Energy Prices
A 33% surge in gasoline prices pushed Canada's headline inflation rate to 3.2% in May, above the 3.0% consensus estimate and the Bank of Canada's 1-3% target band. While the headline figure appears uncomfortably high, it largely reflects rising energy costs and the early second-order effects of Middle East tensions. More importantly, the BoC's preferred core inflation measures remain within target, with CPI median easing to 2.1%, CPI trim holding at 2.2%, and CPI common rising to 2.7%.
BoC Expected to Hold as Growth Weakens
The bigger story may be that bearish bets against the Canadian dollar are becoming stretched. USD/CAD reached a 15-month high ahead of the CPI release, extending a rally that began on May 1 with little evidence of a meaningful pullback. Several CAD crosses were also flirting with breakouts before momentum reversed following the inflation report.
Despite the upside surprise in headline CPI, the Bank of Canada is widely expected to leave rates unchanged at 2.25%. While OIS markets continue to price a small chance of further tightening, weak GDP growth, rising unemployment and subdued business investment argue against additional rate hikes. At the same time, inflation remains elevated enough to deter policymakers from signalling rate cuts, leaving the BoC firmly in wait-and-see mode.
This content was created by an affiliate of FOREX.com and represents the views and opinions of the author/speakers, not the views and opinions of FOREX.com, StoneX Group Inc., or its subsidiaries. The content has not been independently reviewed by FOREX.com.
CME Canadian Dollar (CAD) Futures Market Positioning | COT Report
A clear bearish trend has emerged among Canadian dollar futures traders, with gross short positions rising and gross longs declining among both large speculators and managed funds. While net-short exposure may not yet be at an extreme, sentiment appears increasingly one-sided. Ultimately, there is likely further room for bearish positioning before Canadian dollar bears are forced to capitulate and trigger a more meaningful decline in USD/CAD. However, given the lack of mean reversion across CAD pairs in recent months, traders should remain alert to periodic bouts of short covering. And with the US dollar rally looking increasingly stretched in the near term, USD/CAD may be vulnerable to a corrective pullback.
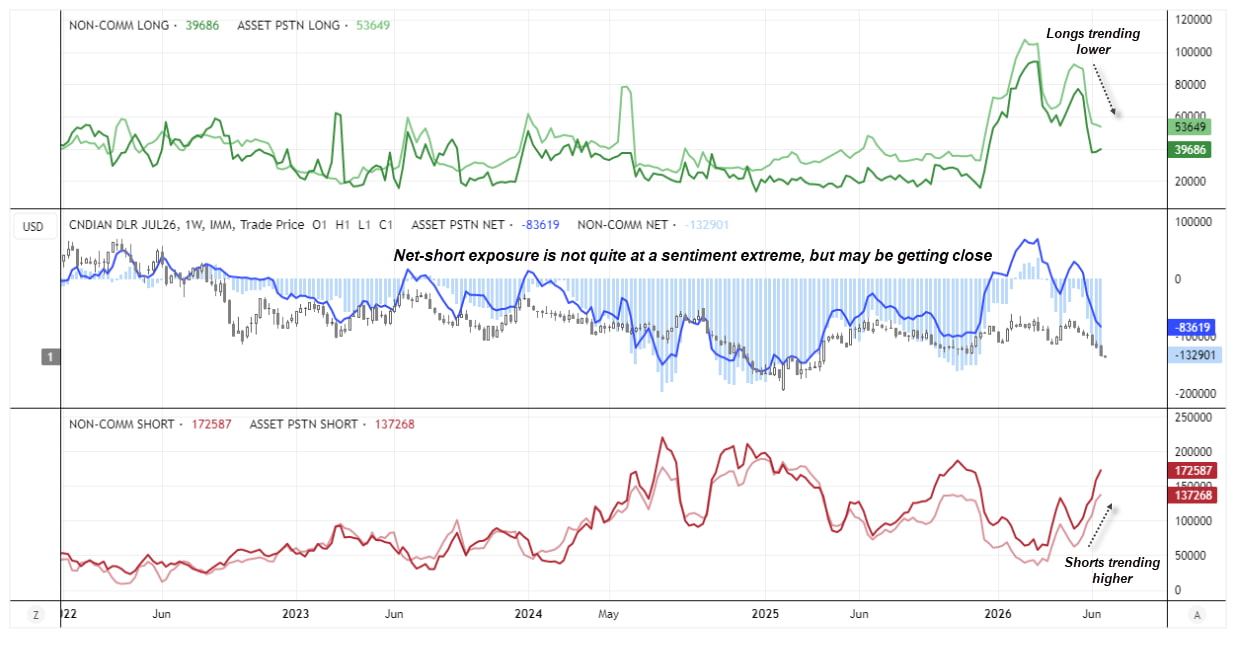
Source: CME, CFTC (COT), LSEG
For traders wanting a deeper understanding of futures positioning, I’ve also published a guide on how to read and interpret weekly COT data in forex markets.
For traders wanting a deeper understanding of futures positioning, I’ve also published a guide on how to read and interpret weekly COT data in forex markets.
USD/CAD Technical Analysis: US Dollar vs Canadian Dollar
USD/CAD Trend Remains Bullish, But Pullback Risks Are Growing
The weekly chart shows a strong rally that appears to be gaining momentum. Yet the weekly RSI (2) has spent the past three weeks in overbought territory and is at its highest level since February 2024, warning the trend may be overstretched in the near term. Importantly, the weekly RSI (14) remains well below overbought territory and continues to trend higher, which supports the view that USD/CAD is more prone to a pullback than a full-blown trend reversal.
Technical Indicators Point to a USD/CAD Correction
The daily chart shows both RSIs are heavily overbought, although only RSI (2) is flashing a bearish divergence. The rally from the May 1 low has been almost uninterrupted, and early signs of exhaustion are emerging with two consecutive shooting star candles. With monthly R3 and weekly R1 pivot points clustered around 1.4250, the upside may be becoming limited.
USD/CAD is also stretched well above its 10 and 20-day EMAs. The detrended price oscillator (lower panel) has reached a prior cycle high relative to its 20-day EMA and sits well above its equilibrium zone.
Taken together, the evidence points to a pullback, particularly if prices break below the 2025 high at 1.4140. However, unless the US dollar receives a strong bearish catalyst, any decline could prove shallow. Initial support levels include the weekly pivot point near 1.41, the 10-day EMA at 1.4070 and the 20-day EMA near the weekly S1 pivot and 1.40 handle, where dip buyers may be waiting.
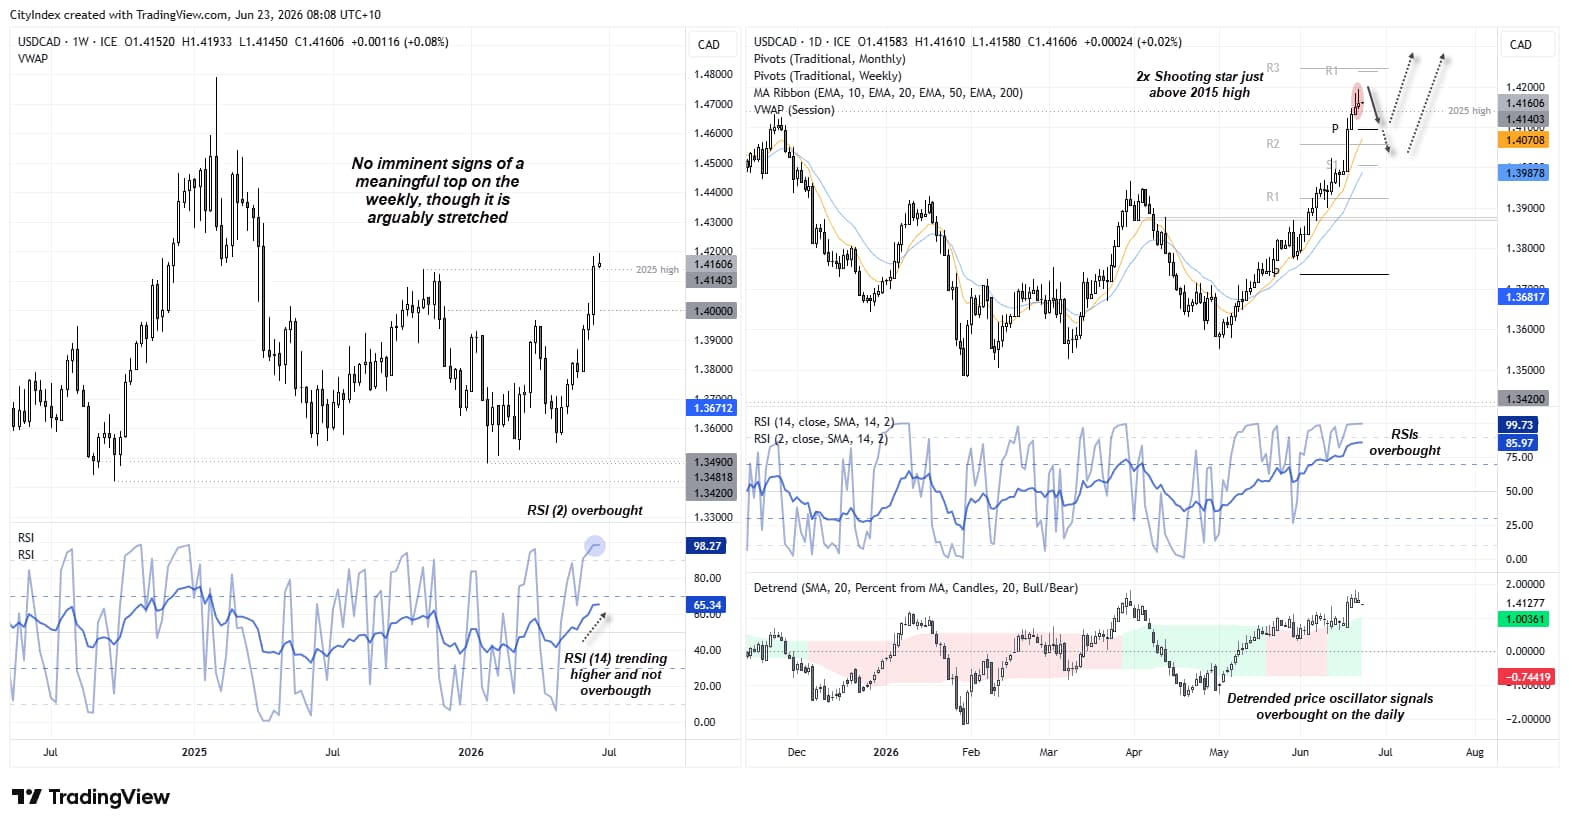
Source: ICE, TradingView


AUD/CAD Technical Analysis: Australian Dollar vs Canadian Dollar
Yesterday I outlined a case for a bounce in AUD/USD, which could initially delay a breakout on AUD/CAD. However, given the strength of the broader trend, an eventual bullish breakout on AUD/CAD still appears likely as the pair targets a move towards parity.
The weekly chart shows a well-established uptrend, with support above the April 2021 high remaining intact despite the recent consolidation. A mild bearish divergence has formed, although momentum is not particularly overbought.
AUD/CAD Bulls Continue to Eye Parity
On the daily chart, shooting star candles have formed around recent cycle highs, warning of a near-term pullback. However, with support from the 10 and 20-day EMAs, the monthly pivot point and a firmly bullish weekly trend, dips are likely to attract buyers. While some bulls may target a pullback towards 0.98 ahead of a move to parity, I suspect any decline will be shallower, with traders instead looking for evidence of a swing low around the monthly pivot point.
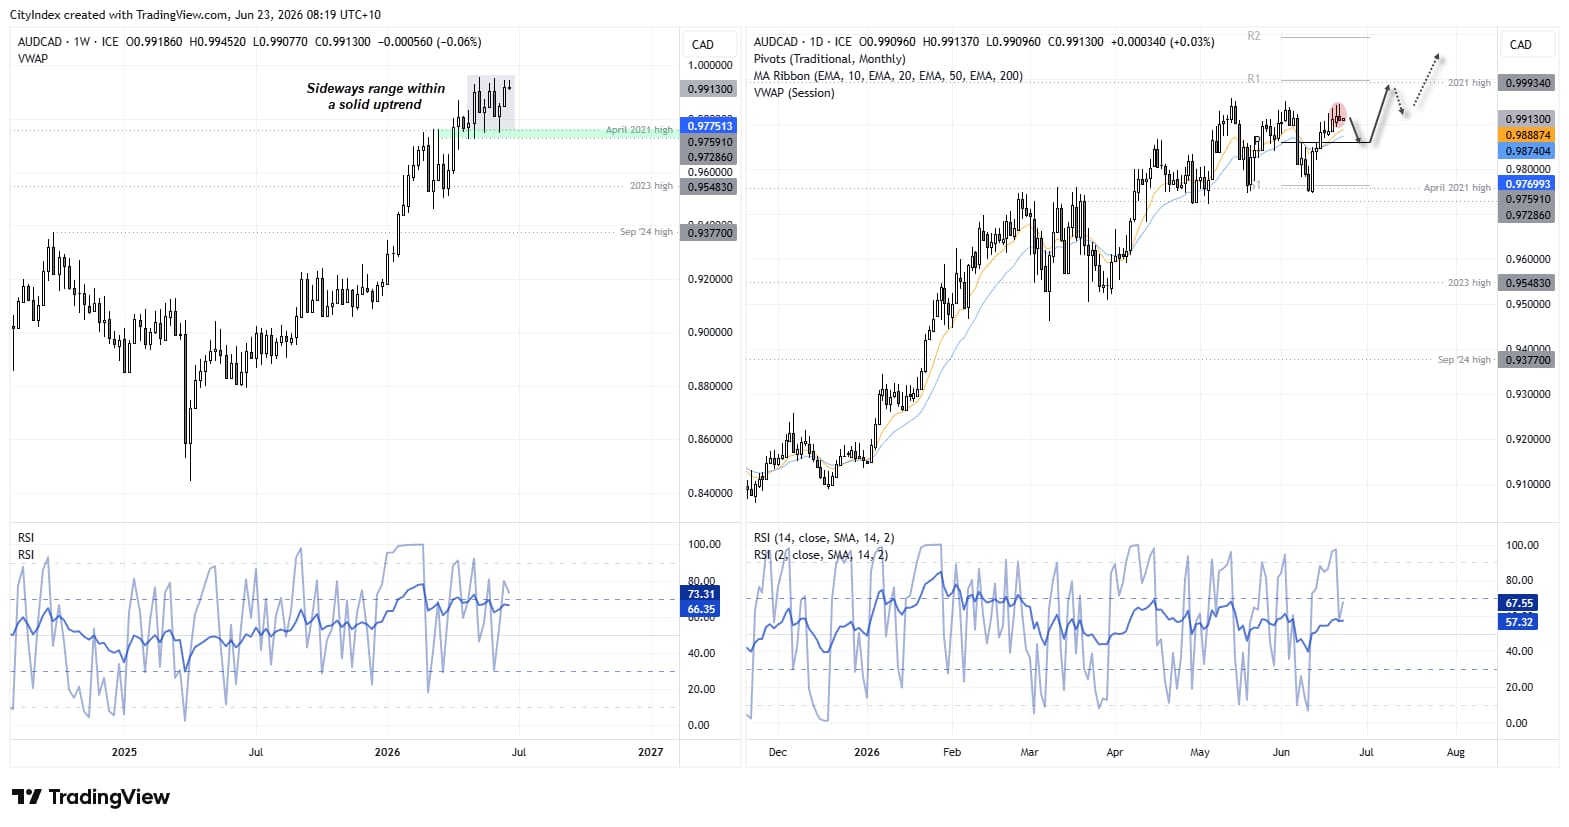
Source: ICE, TradingView


EUR/CAD Technical Analysis: Euro vs Canadian Dollar
Out of the three Canadian dollar crosses, EUR/CAD looks the most vulnerable to a semi-decent pullback. Its rally on the daily chart has been erratic compared to USD/CAD and AUD/CAD, and volatility has perked up around the April high. Several of the candles show upper wicks and false intraday breaks above that April high, which makes Monday’s relatively volatile bearish inside day the more interesting.
Bears could seek to fade into moves within Monday’s range for a potential move down to 1.61 – near the current month’s VPOC (volume point of control).
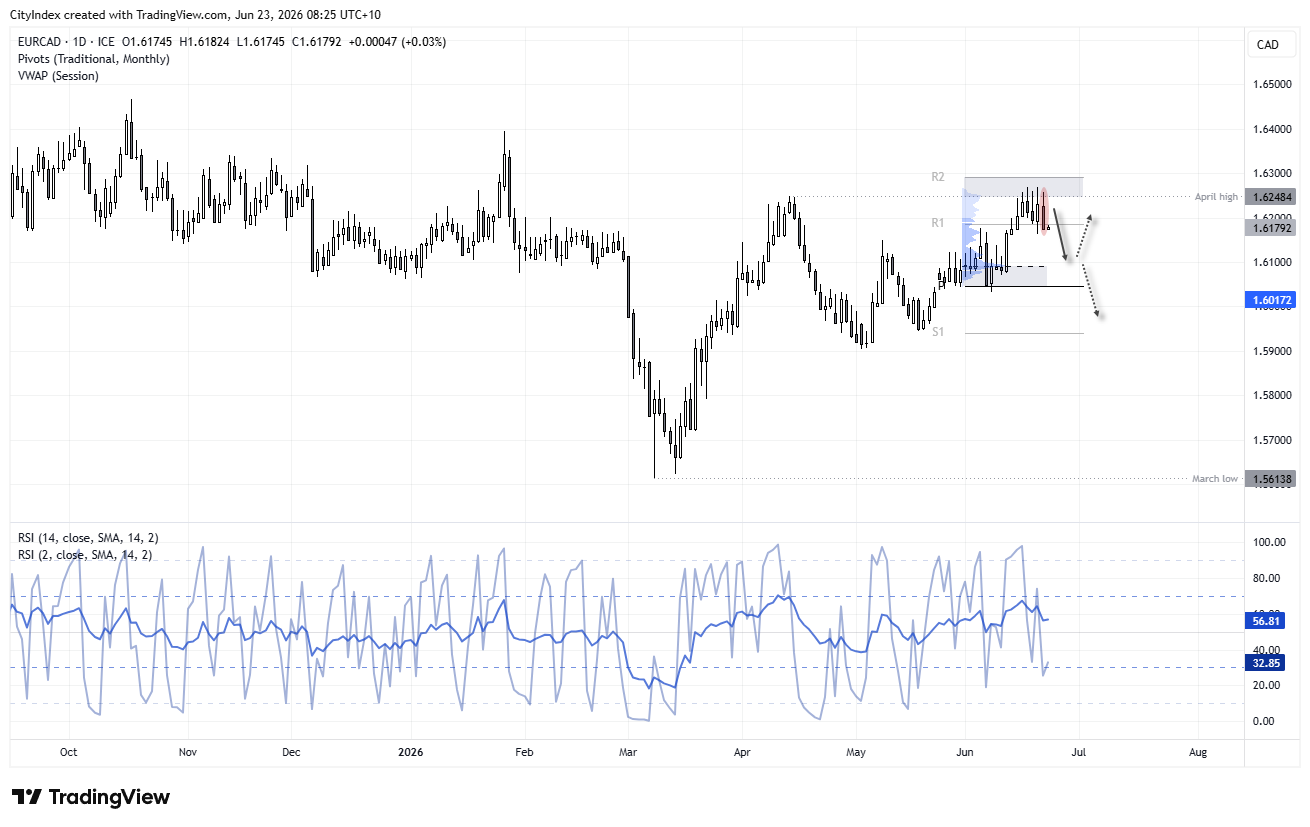
Source: ICE, TradingView
View the full economic calendar
View the full economic calendar
-- Written by Matt Simpson
Follow Matt on Twitter @cLeverEdge
How to trade with City Index
You can trade with City Index by following these four easy steps:
- Open an account, or log in if you’re already a customer
• Open an account in the UK
• Open an account in Australia
• Open an account in Singapore
- Search for the market you want to trade in our award-winning platform
- Choose your position and size, and your stop and limit levels
- Place the trade
Related tags:
Latest market news




The complete CFD trading experience
Award-winning platforms, competitive spreads, low commissions and dedicated support.
We live and breathe the markets and are dedicated to helping traders realise their ambitions as we continue to set the industry bar.
Economic calendar
Web Trader platform
Our sophisticated web-based platform is packed with features.
Related articles
EUR/USD weekly outlook: FOMC and ECB to set the tone
The current backdrop is modestly bearish. On Friday, the EUR/USD closed modestly lower, down for the third consecutive day. The pair also posted a weekly decline after staging a modest recovery attempt in the previous week. Out of the past 8 weeks, the EUR/USD has fallen on 6 occasions. There is not much supporting factors for the single currency right now. So, the upside remains capped.

USD/JPY Forecast: Is Rising Japanese Inflation Supporting the Yen?
As the trading week comes to an end, one of the most relevant developments in the FX market has been the renewed strength of the Japanese yen. This can be seen in the recent performance of USD/JPY, which has fallen nearly 1.0% over the last two trading sessions, highlighting a meaningful recovery in the Japanese currency against the U.S. dollar.


US Dollar Price Action Setups: EUR/USD, USD/JPY, GBP/USD, USD/CAD
The Dollar is working on its second consecutive red week and while sellers didn’t exactly pounce on fresh lows, there’s an opening door for bears to make a move.

StoneX Europe Ltd may make third party material available on this website which may contain information included but not limited to the conditions of financial markets. The material is for information purposes only and does not contain, and should not be construed as containing, investment advice and/or investment recommendation and/or an investment research and/or an offer of or solicitation for any transactions in financial instruments; any decision to enter into a specific transaction shall be made by the client following an assessment by him/her of their situation.
StoneX Europe Ltd makes no representation or warranty and assumes no liability as to the accuracy or completeness of the information provided, nor any loss arising from any investment based on a recommendation, forecast or other information supplied. You should always seek independent advice as to your suitability to speculate in any related markets and your ability to assume the associated risks, if you are at all unsure. We are not under any obligation to update any such material. Any opinion made may be personal to the author and may not reflect the opinion of StoneX Europe Ltd.