






Canadian Employment Change in line as data continues to show improvement
With a string of positive jobs data from Canada, the BOC may feel like they are in a better position to continue with their tapering at the next meeting
Share this:

Canada’s employment change for the month of August came in roughly as expected: +90,200 vs +100,000 expected. The breakdown between full-time jobs and part-time jobs had a nice distribution, with three-fourths of the jobs going to full-time positions and one-fourth to part-time positions. The unemployment rate fell to 7.1% from 7.5%, vs 7.3% expected. In addition, Average Hourly Earnings were up 1.25% (YoY) vs 0.6% in July and +0.5% expected.
After lockdowns in Canada throughout the spring, job growth has expanded 3 months in a row. However, the BOC was not ready to continue with their tapering this week, as they are still concerned about supply chain and pandemic-related risks! GDP for Q2 released on August 31st showed that GDP fell by 0.3% vs a growth of 1.4% in Q1. Yet signs are emerging of a stronger Q3, including stronger manufacturing, retail sales and now employment. In addition, inflation is running high. If this continues, taken together, this may be a reason for the BOC to taper at their next meeting.
Everything you wanted to know about the Bank of Canada
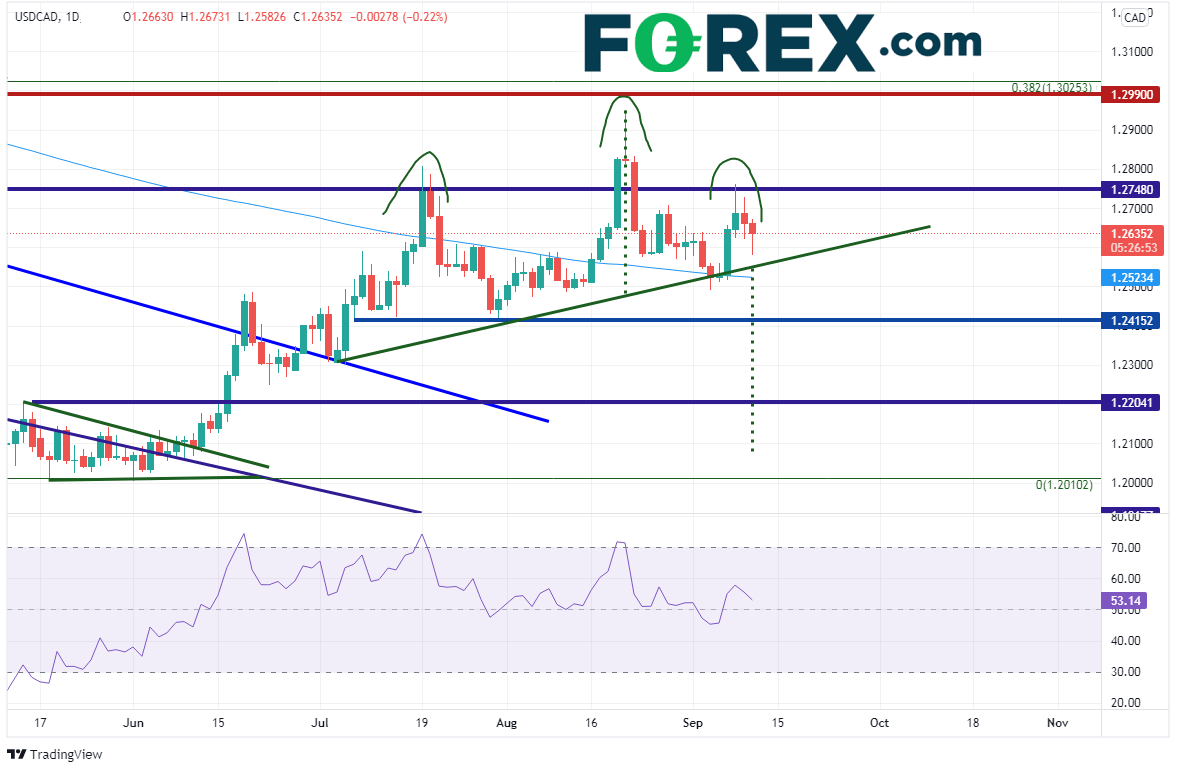
On a daily timeframe, it appears that USD/CAD may be trying to carve out a head and shoulders formation. After failing to push through strong resistance near 1.2990, the pair formed an evening star pattern and moved lower to test the 200 Day Moving Average and the potential neckline of the pattern near 1.2525. The pair bounced to resistance and may currently be forming the right shoulder of the pattern. However, the neckline and the 200 Day Moving Average offer support between 1.2523 and 1.2550.
Source: Tradingview, Stone X
Trade USD/CAD now: Login or Open a new account!
• Open an account in the UK
• Open an account in Australia
• Open an account in Singapore
In addition, on a 240-minute timeframe, there is a strong support zone between 1.2500 and 1.2600. 1.2591 is also the 38.2% Fibonacci retracement from the June 1st lows to the August 20th highs. If price can manage to break through 1.2500, the next support level is 1.2415. Below there, USD/CAD can fall to horizontal support near 1.2200. The target for the head and shoulders pattern is near 1.2100!
Source: Tradingview, Stone X
If USD/CAD can manage to hold the 1.2500 level, resistance is at the September 8th highs near 1.2760, the August 20th highs at 1.2952 and the long-term horizontal resistance near 1.2990.
With a string of positive jobs data from Canada, the BOC may feel like they are in a better position to continue with their tapering at the next meeting. Add in strong manufacturing and retail sales, and it makes their case even stronger. This could cause USD/CAD to move lower. However, there is a good deal of support between 1.2500 and 1.2600 that price must get through first!
Learn more about forex trading opportunities.
Canada’s employment change for the month of August came in roughly as expected: +90,200 vs +100,000 expected. The breakdown between full-time jobs and part-time jobs had a nice distribution, with three-fourths of the jobs going to full-time positions and one-fourth to part-time positions. The unemployment rate fell to 7.1% from 7.5%, vs 7.3% expected. In addition, Average Hourly Earnings were up 1.25% (YoY) vs 0.6% in July and +0.5% expected.
After lockdowns in Canada throughout the spring, job growth has expanded 3 months in a row. However, the BOC was not ready to continue with their tapering this week, as they are still concerned about supply chain and pandemic-related risks! GDP for Q2 released on August 31st showed that GDP fell by 0.3% vs a growth of 1.4% in Q1. Yet signs are emerging of a stronger Q3, including stronger manufacturing, retail sales and now employment. In addition, inflation is running high. If this continues, taken together, this may be a reason for the BOC to taper at their next meeting.
Everything you wanted to know about the Bank of Canada
On a daily timeframe, it appears that USD/CAD may be trying to carve out a head and shoulders formation. After failing to push through strong resistance near 1.2990, the pair formed an evening star pattern and moved lower to test the 200 Day Moving Average and the potential neckline of the pattern near 1.2525. The pair bounced to resistance and may currently be forming the right shoulder of the pattern. However, the neckline and the 200 Day Moving Average offer support between 1.2523 and 1.2550.
Source: Tradingview, Stone X
Trade USD/CAD now: Login or open a new account!
In addition, on a 240-minute timeframe, there is a strong support zone between 1.2500 and 1.2600. 1.2591 is also the 38.2% Fibonacci retracement from the June 1st lows to the August 20th highs. If price can manage to break through 1.2500, the next support level is 1.2415. Below there, USD/CAD can fall to horizontal support near 1.2200. The target for the head and shoulders pattern is near 1.2100!
Source: Tradingview, Stone X
If USD/CAD can manage to hold the 1.2500 level, resistance is at the September 8th highs near 1.2760, the August 20th highs at 1.2952 and the long-term horizontal resistance near 1.2990.
With a string of positive jobs data from Canada, the BOC may feel like they are in a better position to continue with their tapering at the next meeting. Add in strong manufacturing and retail sales, and it makes their case even stronger. This could cause USD/CAD to move lower. However, there is a good deal of support between 1.2500 and 1.2600 that price must get through first!
Learn more about forex trading opportunities.
Related tags:


The complete CFD trading experience
Award-winning platforms, competitive spreads, low commissions and dedicated support.
We live and breathe the markets and are dedicated to helping traders realise their ambitions as we continue to set the industry bar.
Economic calendar
Web Trader platform
Our sophisticated web-based platform is packed with features.
Related articles
USD/CAD shooting star puts September surge on notice
USD/CAD has printed a clear bearish reversal pattern after an extraordinary September surge, but confirmation may depend heavily on how US Treasury yields react to Friday’s payrolls report.

USD/MXN Analysis: Is Super Peso Starting to Fade?
Over recent trading sessions, the Mexican peso has continued to show signs of weakness against the U.S. dollar. This can already be seen in USD/MXN, which has gained more than 1.7% over the last three sessions, highlighting sustained buying pressure in favor of the dollar in the short term.


Canadian Dollar Analysis: USD/CAD Returns to July Highs Ahead of NFP
The Canadian dollar continues to face one of its most challenging environments in recent months when it comes to maintaining strength against the U.S. dollar. The weakness of the Canadian currency is clearly reflected in USD/CAD, which has now recorded nine consecutive bullish sessions and gained more than 1.7% during that period.
StoneX Europe Ltd may make third party material available on this website which may contain information included but not limited to the conditions of financial markets. The material is for information purposes only and does not contain, and should not be construed as containing, investment advice and/or investment recommendation and/or an investment research and/or an offer of or solicitation for any transactions in financial instruments; any decision to enter into a specific transaction shall be made by the client following an assessment by him/her of their situation.
StoneX Europe Ltd makes no representation or warranty and assumes no liability as to the accuracy or completeness of the information provided, nor any loss arising from any investment based on a recommendation, forecast or other information supplied. You should always seek independent advice as to your suitability to speculate in any related markets and your ability to assume the associated risks, if you are at all unsure. We are not under any obligation to update any such material. Any opinion made may be personal to the author and may not reflect the opinion of StoneX Europe Ltd.