



Central Banks, USD Majors, Gold, Bitcoin, Equities Weekly Technical Outlook
Sr. Technical Strategist Michael Boutros highlights the levels that matter on the USD Majors, commodities, and equity indices charts this week.
Share this:

Weekly Technical Trade Levels on USD Majors, Commodities & Stocks
- Technical trade setups we are tracking into the start of the week on the USD Majors, commodities, bitcoin, and equity indices.
- Next Weekly Strategy Webinar: Monday, May 4 at 8:30am ET
- Review the latest Video Updates or Stream Live on my YouTube playlist
In this webinar we take an in-depth look at the technical trade levels for the US Dollar (DXY), Euro (EUR/USD), British Pound (GBP/USD), Australian Dollar (AUD/USD), Canadian Dollar (USD/CAD), Japanese Yen (USD/JPY), Swiss Franc (USD/CHF), Gold (XAU/USD), Crude Oil (WTI), and Bitcoin (BTC/USD), and S&P 500 (SPX500), Nasdaq (NDX), and Dow Jones (DJI). These are the levels that matter on the technical charts into the weekly open.
Euro Price Chart – EUR/USD Daily
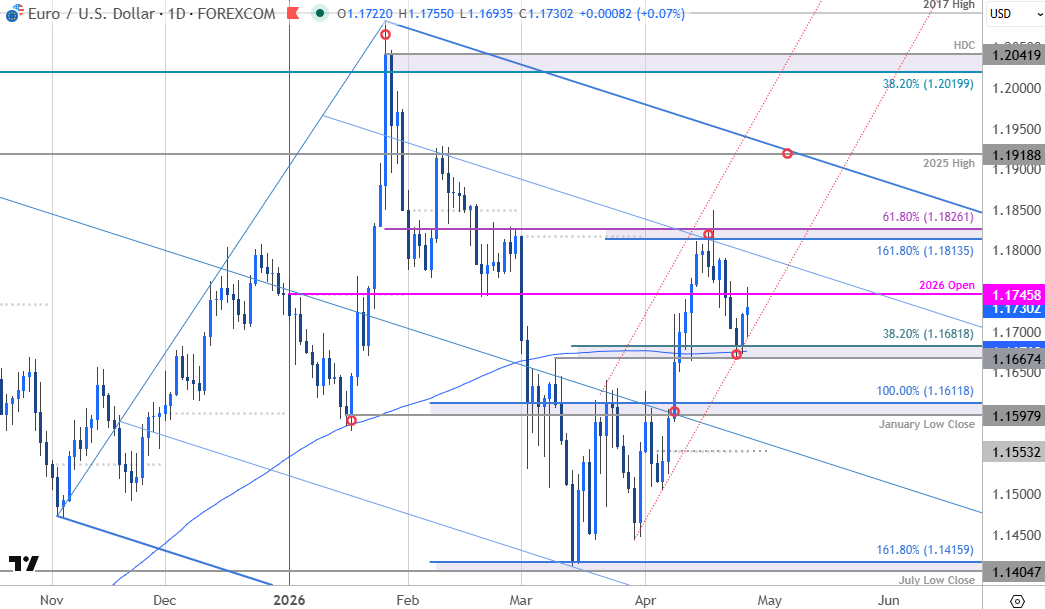
Chart Prepared by Michael Boutros, Sr. Technical Strategist; EUR/USD on TradingView
Notes: EUR/USD rebounded off confluent support last week at 1.1667/82- a region defined by the March 10 swing high, the 200-day moving average, and the 38.2% retracement of the March advance. Note that basic channel support converged on this threshold last week. The pair exhausted into yearly open resistance into the start of the week at 1.1745 and the immediate focus is on a breakout of this range for guidance.
Key resistance remains unchanged at 1.1814/26- a region defined by the 1.618% extension of the March advance, the March high, and the 61.8% retracement of the January decline. A breach / daily close above this threshold is needed to mark uptrend resumption towards the 2025 swig high at 1.1919. A break below this key support zone would invalidate the March uptrend and threaten a drop towards the January low close & the 100% extension of the January decline at 1.1598-1.1612. Look for a larger reaction there IF reached.
Bottom line: A rebound off key support takes Euro into yearly open resistance. From a trading standpoint, the immediate focus is on a breakout of the 1.1667-1.1745 zone for guidance with a close above 1.1826 ultimately needed to mark uptrend resumption.
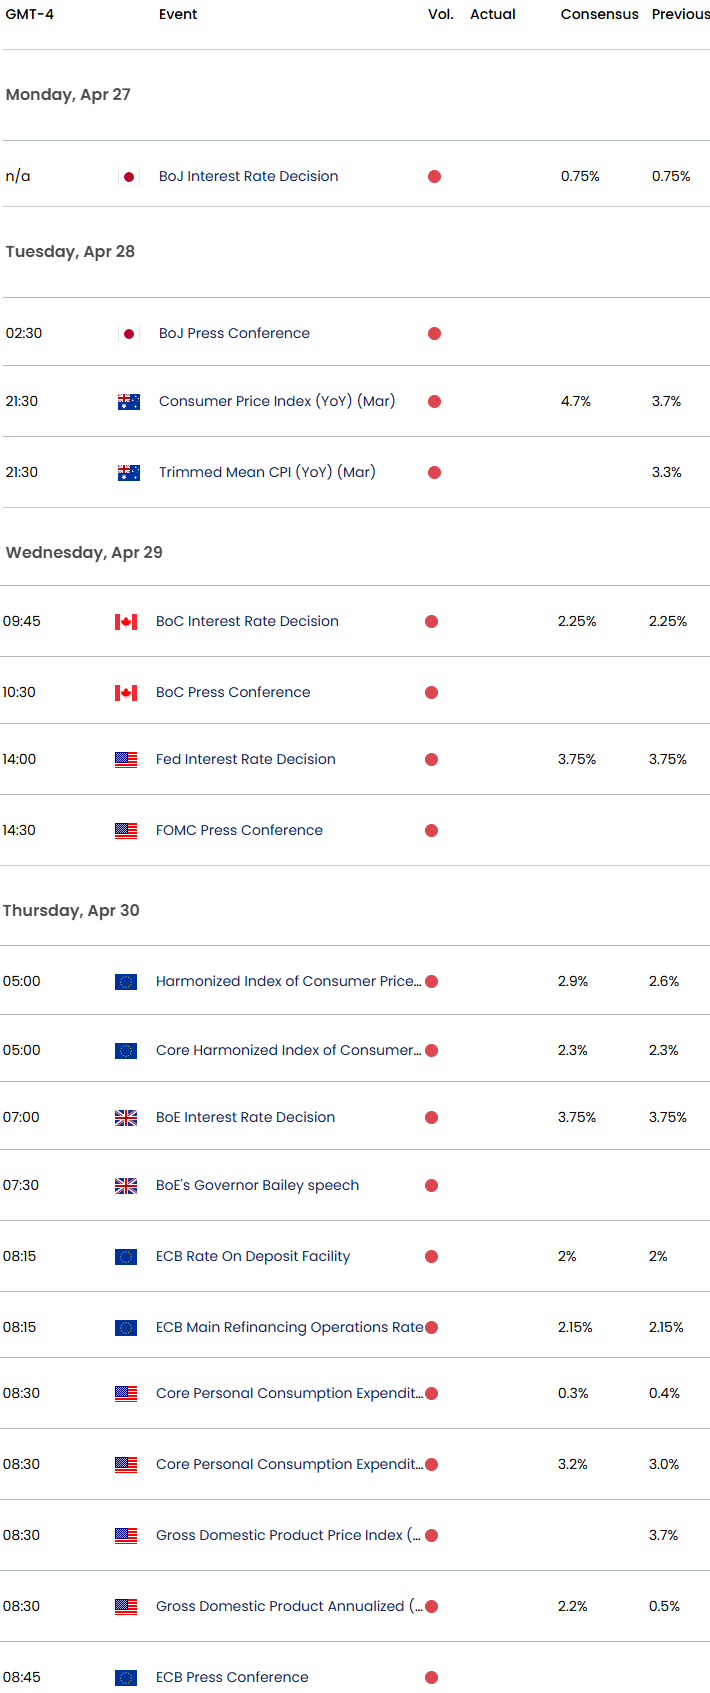
Keep in mind the Fed is on tap Wednesday with the ECB rate decision on Thursday. While no change is expected from any central banks this week, markets will parse the commentary for signals on how policymakers are assessing inflation—particularly from higher energy prices—and the outlook for monetary policy. Stay nimble into the monthly cross and watch the weekly close here.

British Pound Price Chart – GBP/USD Daily
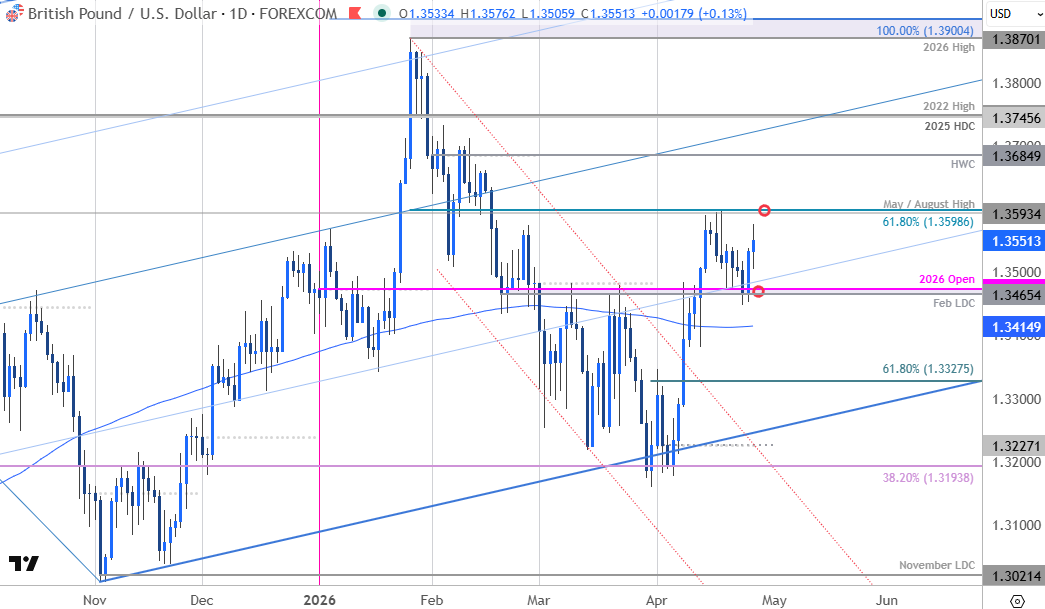
Chart Prepared by Michael Boutros, Sr. Technical Strategist; GBP/USD on TradingView
Notes: GBP/USD rebounded off confluent support last week at the February low-day close (LDC) and the yearly open at 1.3465/74. Key resistance remains unchanged at 1.3596/99- a region defined by the May & August highs and the 61.8% retracement of the year-to-date range. The focus heading into the close of the month is on a breakout of this range for guidance.
A topside breach / close above the 1.36-handle is needed to mark resumption of the multi-week uptrend towards the yearly high-week close (HWC) at 1.3685 and the 2025 high-day close (HDC) / 2022 swing high at 1.3745/49. Look for a larger reaction there IF reached.
A break lower exposes the 200-day / 52-week moving averages at 1.3413/30- a break / daily close below this threshold would suggest a more significant high is in place and a larger reversal is underway. Subsequent support rests with the 61.8% retracement of the late-March advance at 1.3328.
Bottom line: Sterling remains in a well-defined range just below resistance and the focus is on a breakout here for near-term guidance. From a trading standpoint, losses would need to be limited to the 200DMA IF price is heading higher on this stretch with a close above 1.3598 needed to fuel the next major leg of the advance. Keep in mind the Bank of England rate decision is on tap Thursday after the Fed. Stay nimble into the monthly cross and watch the weekly close here.

Gold Price Chart – XAU/USD Daily
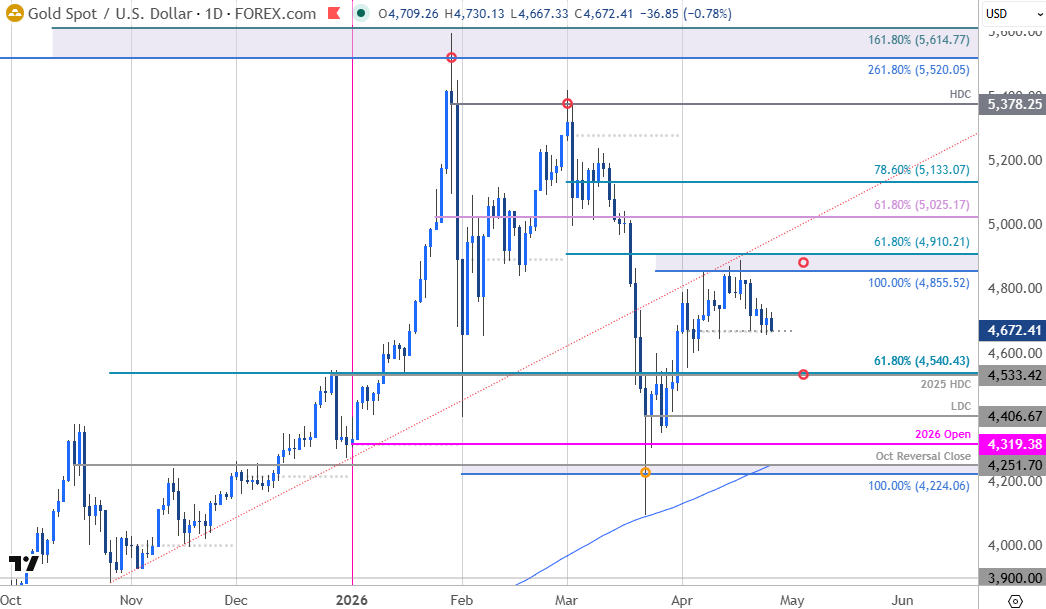
Chart Prepared by Michael Boutros, Sr. Technical Strategist; XAU/USD on TradingView
Notes: In my last Weekly Technical Outlook we noted that gold was trading just below pivotal resistance and that, “from a trading standpoint, losses would need to be limited to the monthly open (4669) IF price is heading higher on this stretch with a close above 4910 needed to fuel the next major leg of the advance.” XAU/USD plunged more than 4.6% off the monthly high with the bears testing monthly open support for the fourth time in five days.
Is a more significant near-term high in place? The focus is on a reaction off this level. A break / daily close below would threaten a deeper setback towards pivotal support at the 2025 high-day close (HDC) and the 61.8% retracement of the October advance at 4533/40. Key resistance remains unchanged at 4855-4910 - a region defined by the 100% extension of the March advance and the 61.8% retracement of the March decline. Strength beyond this threshold would mark resumption of the late-March uptrend towards the 61.8% retracement of the year-to-date range at 5025 and 5133.
Bottom line: Gold is trading just above support at the April open with the monthly opening-range intact. From a trading standpoint, the focus is on a reaction off this mark for guidance- ultimately, the broader outlook remains constructive while above 4533 with a close above 4910 needed to fuel the next leg of the advance.
There is lots of event risk for gold this week with the central banks and numerous inflation reports on tap. Keep your eyes on the war headlines as talks between the U.S. and Iran move forward and watch the weekly close for guidance here.

Economic Calendar – Key Data Releases
Economic Calendar - latest economic developments and upcoming event risk.
--- Written by Michael Boutros, Senior Technical Strategist
Follow Michael on X @MBForex


The complete CFD trading experience
Award-winning platforms, competitive spreads, low commissions and dedicated support.
We live and breathe the markets and are dedicated to helping traders realise their ambitions as we continue to set the industry bar.
Economic calendar
Web Trader platform
Our sophisticated web-based platform is packed with features.
Related articles
USD/CAD shooting star puts September surge on notice
USD/CAD has printed a clear bearish reversal pattern after an extraordinary September surge, but confirmation may depend heavily on how US Treasury yields react to Friday’s payrolls report.

USD/MXN Analysis: Is Super Peso Starting to Fade?
Over recent trading sessions, the Mexican peso has continued to show signs of weakness against the U.S. dollar. This can already be seen in USD/MXN, which has gained more than 1.7% over the last three sessions, highlighting sustained buying pressure in favor of the dollar in the short term.


Canadian Dollar Analysis: USD/CAD Returns to July Highs Ahead of NFP
The Canadian dollar continues to face one of its most challenging environments in recent months when it comes to maintaining strength against the U.S. dollar. The weakness of the Canadian currency is clearly reflected in USD/CAD, which has now recorded nine consecutive bullish sessions and gained more than 1.7% during that period.
StoneX Europe Ltd may make third party material available on this website which may contain information included but not limited to the conditions of financial markets. The material is for information purposes only and does not contain, and should not be construed as containing, investment advice and/or investment recommendation and/or an investment research and/or an offer of or solicitation for any transactions in financial instruments; any decision to enter into a specific transaction shall be made by the client following an assessment by him/her of their situation.
StoneX Europe Ltd makes no representation or warranty and assumes no liability as to the accuracy or completeness of the information provided, nor any loss arising from any investment based on a recommendation, forecast or other information supplied. You should always seek independent advice as to your suitability to speculate in any related markets and your ability to assume the associated risks, if you are at all unsure. We are not under any obligation to update any such material. Any opinion made may be personal to the author and may not reflect the opinion of StoneX Europe Ltd.