





CPI data Buy the Rumor Sell the Fact DXY EURUSD
While it is true that March’s print is much stronger, the YoY data is distorted.
Share this:

The US March CPI headline YoY print was 2.6% vs 1.7% in February. 2.5% was expected. While it is true that March’s print is much stronger, the YoY data is distorted. Recall that between March and May last year, businesses were closing their doors and lockdowns were in place for much of the US. The CPI prints were dismal. That data has skewed the YoY print and is one of the main reasons the Fed says that the data is “hard to read” or that it is “transitory”. The core CPI YoY print was not as dramatic, coming in at 1.6% vs 1.3% in February and 1.5% expected. The headline MoM print was also slightly higher at 0.6% vs 0.4% in February and 0.5% expected.
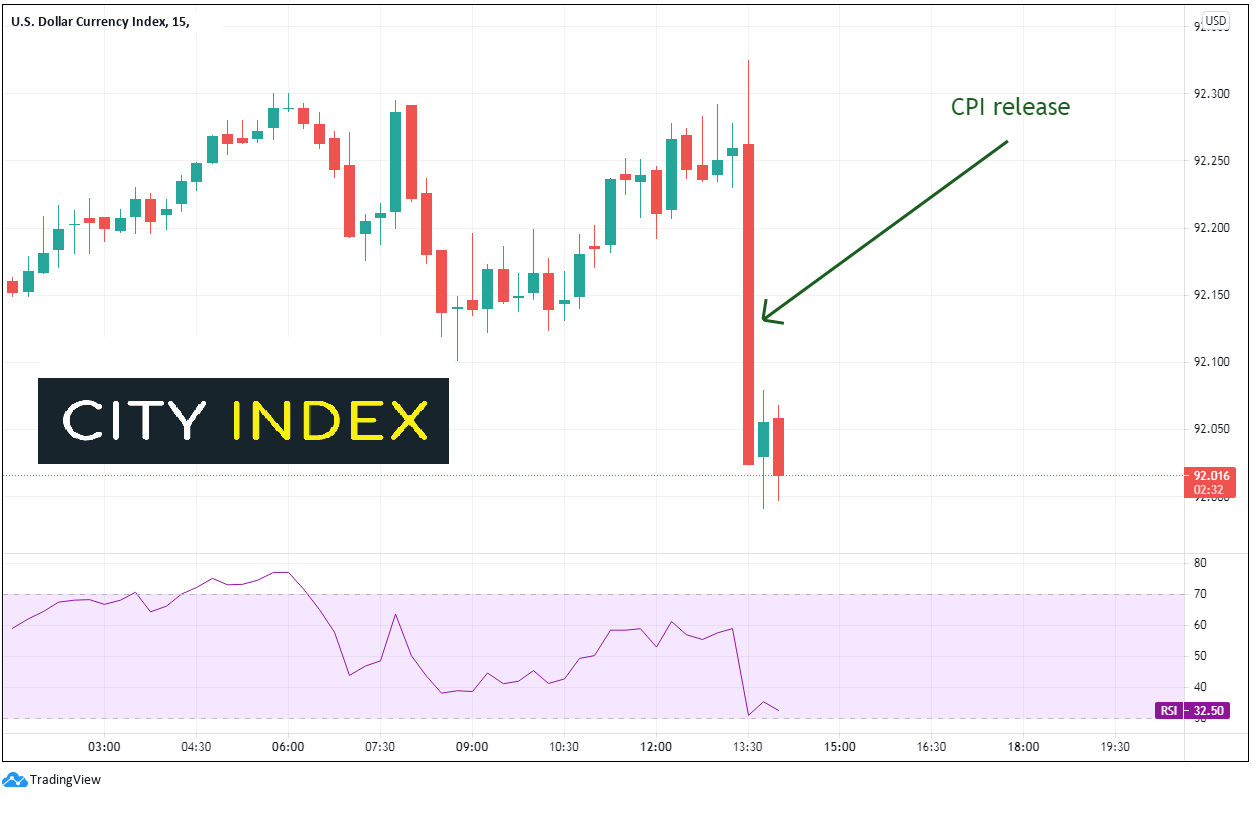
Traders read right through the seemingly dramatic jump in the consumer price index. One could expect that a reading such as this would send stocks lower, with yields and the US Dollar moving higher. However, economists telegraphed the number well in advance. Therefore, traders reacted in a “buy the rumor, sell the fact” manner. The US Dollar Index (DXY) moved from 92.26 down to 92.03 within the first 15 minutes after the print.
Source: Tradingview, City Index
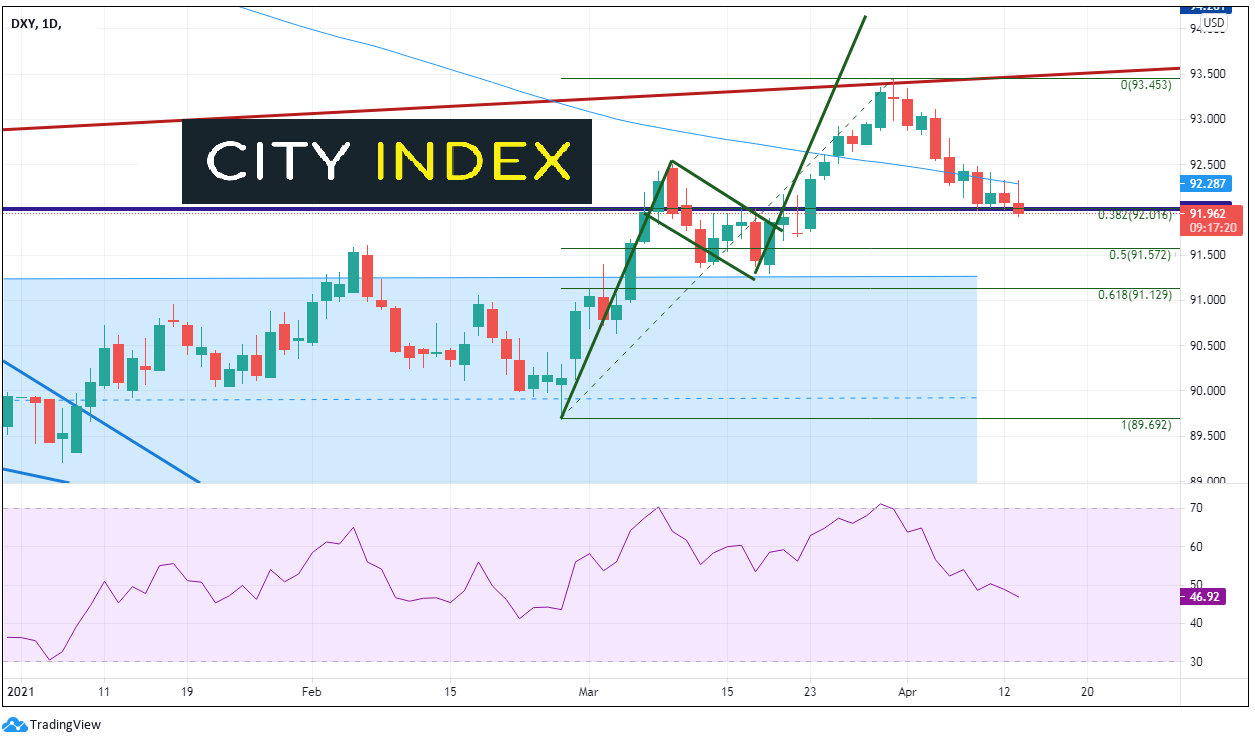
The selling was too much for buyers to overcome at the 38.2% Fibonacci retracement from the February 25th lows to the March 31st highs, as well as horizontal support. A close above 92.00 would still give bulls hope for a move higher on a daily timeframe. The 50% retracement from the same timeframe is first support at 91.57. Resistance is near the 200 Day Average and today’s highs near 92.30. March 18th lows and the top of a large band of support is the next level of support near 91.30.
Source: Tradingview, City Index
As one may suspect, with the DXY moving lower, EUR/USD has moved higher. Within 15 minutes of the data, EUR/USD moved from 1.1894 to 1.1927.
Source: Tradingview, City Index
On the move higher, EUR/USD pushed to its highest level since March 23rd. It has moved above the 38.2% Fibonacci retracement level from the February 25th highs to the March 31st lows at 1.1908 horizontal resistance. The next level of resistance is at the 50% retracement level from the same timeframe, near 1.1970, and then March 18th highs of 1.1989. Support below is at the 200 Day Moving Average and todays lows between 1.1876 and 1.1893.
Source: Tradingview, City Index
The jump in headline CPI was dramatic, no mistake about it. However, it was expected well in advance due to distortions from the pandemic data 1 year ago. Expect many of the upcoming YoY data prints to be similar. But these numbers will be expected well in advance, don’t get caught on the wrong side of that line!
Learn more about forex trading opportunities.
The US March CPI headline YoY print was 2.6% vs 1.7% in February. 2.5% was expected. While it is true that March’s print is much stronger, the YoY data is distorted. Recall that between March and May last year, businesses were closing their doors and lockdowns were in place for much of the US. The CPI prints were dismal. That data has skewed the YoY print and is one of the main reasons the Fed says that the data is “hard to read” or that it is “transitory”. The core CPI YoY print was not as dramatic, coming in at 1.6% vs 1.3% in February and 1.5% expected. The headline MoM print was also slightly higher at 0.6% vs 0.4% in February and 0.5% expected.
Traders read right through the seemingly dramatic jump in the consumer price index. One could expect that a reading such as this would send stocks lower, with yields and the US Dollar moving higher. However, economists telegraphed the number well in advance. Therefore, traders reacted in a “buy the rumor, sell the fact” manner. The US Dollar Index (DXY) moved from 92.26 down to 92.03 within the first 15 minutes after the print.
Source: Tradingview, FOREX.com
The selling was too much for buyers to overcome at the 38.2% Fibonacci retracement from the February 25th lows to the March 31st highs, as well as horizontal support. A close above 92.00 would still give bulls hope for a move higher on a daily timeframe. The 50% retracement from the same timeframe is first support at 91.57. Resistance is near the 200 Day Average and today’s highs near 92.30. March 18th lows and the top of a large band of support is the next level of support near 91.30.
Source: Tradingview, FOREX.com
As one may suspect, with the DXY moving lower, EUR/USD has moved higher. Within 15 minutes of the data, EUR/USD moved from 1.1894 to 1.1927.
Source: Tradingview, FOREX.com
On the move higher, EUR/USD pushed to its highest level since March 23rd. It has moved above the 38.2% Fibonacci retracement level from the February 25th highs to the March 31st lows at 1.1908 horizontal resistance. The next level of resistance is at the 50% retracement level from the same timeframe, near 1.1970, and then March 18th highs of 1.1989. Support below is at the 200 Day Moving Average and todays lows between 1.1876 and 1.1893.
Source: Tradingview, FOREX.com
The jump in headline CPI was dramatic, no mistake about it. However, it was expected well in advance due to distortions from the pandemic data 1 year ago. Expect many of the upcoming YoY data prints to be similar. But these numbers will be expected well in advance, don’t get caught on the wrong side of that line!
Related tags:

The complete CFD trading experience
Award-winning platforms, competitive spreads, low commissions and dedicated support.
We live and breathe the markets and are dedicated to helping traders realise their ambitions as we continue to set the industry bar.
Economic calendar
Web Trader platform
Our sophisticated web-based platform is packed with features.
Related articles

USD/JPY weekly outlook: Quarter turn scrambles rates regime
USD/JPY’s tight relationship with front-end US rates broke down sharply last week, but quarter-turn flows and positioning suggest the disconnect may prove temporary.


USD/CAD forecast: rally could accelerate above June highs at 1.4250
USD/CAD recovered quickly after weaker US jobs data, keeping the bullish trend in focus. A move above the June highs could accelerate the rally as inflation keeps the Fed under pressure.


USD Sets Fresh Yearly High as EUR/USD Drops Dramatically, USD/JPY Stable
Well, it was a week of USD strength that wasn’t entirely pushed by USD/JPY, as a strong sell-off in EUR/USD has pushed the major pair to its most oversold state in a decade.

StoneX Europe Ltd may make third party material available on this website which may contain information included but not limited to the conditions of financial markets. The material is for information purposes only and does not contain, and should not be construed as containing, investment advice and/or investment recommendation and/or an investment research and/or an offer of or solicitation for any transactions in financial instruments; any decision to enter into a specific transaction shall be made by the client following an assessment by him/her of their situation.
StoneX Europe Ltd makes no representation or warranty and assumes no liability as to the accuracy or completeness of the information provided, nor any loss arising from any investment based on a recommendation, forecast or other information supplied. You should always seek independent advice as to your suitability to speculate in any related markets and your ability to assume the associated risks, if you are at all unsure. We are not under any obligation to update any such material. Any opinion made may be personal to the author and may not reflect the opinion of StoneX Europe Ltd.