



Crude Oil Weekly Outlook: Market Sentiment Adds Further Pressure on Oil Prices
Crude Oil Weekly Outlook: While rate cuts and trade deals remain on the horizon, shutdown risks are taking a heavier toll on markets heading into year-end.
Share this:

Key Events
- The U.S. government shutdown continues to weigh on market sentiment, with U.S. indices and crude oil both reaching critical support levels.
- U.S. CPI data is scheduled for release this week but remains overshadowed by the government shutdown.
- Chinese CPI rises back near yearly highs, reaching +0.2%.
Technical Analysis: Quantifying Uncertainties
WTI Outlook: Weekly Time Frame – Log Scale
Source: Tradingview
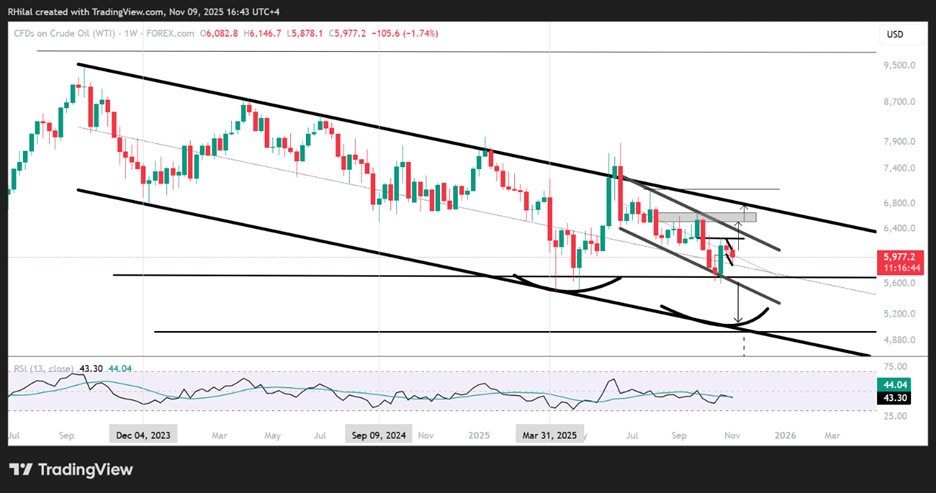
U.S. oil prices continue to respect the boundaries of a downward channel connecting consecutive lower highs and lower lows since 2022.
The latest price action is holding near the mid-zone of the channel, slightly above the $59 mark, pressured by risk-off sentiment driven by the prolonged U.S. government shutdown that began in early October 2025, the wave of AI-related layoffs, and overall stretched market sentiment as 2025 comes to a close.
A turnaround in sentiment could redirect oil prices toward the $70 mark, while further deterioration may pressure prices toward another critical support near $49.
Key levels across U.S. indices may confirm whether a broader market downturn or a potential turnaround is developing:
Dow Jones, Nasdaq, and S&P 500 – 3-Day Time Frame Outlook 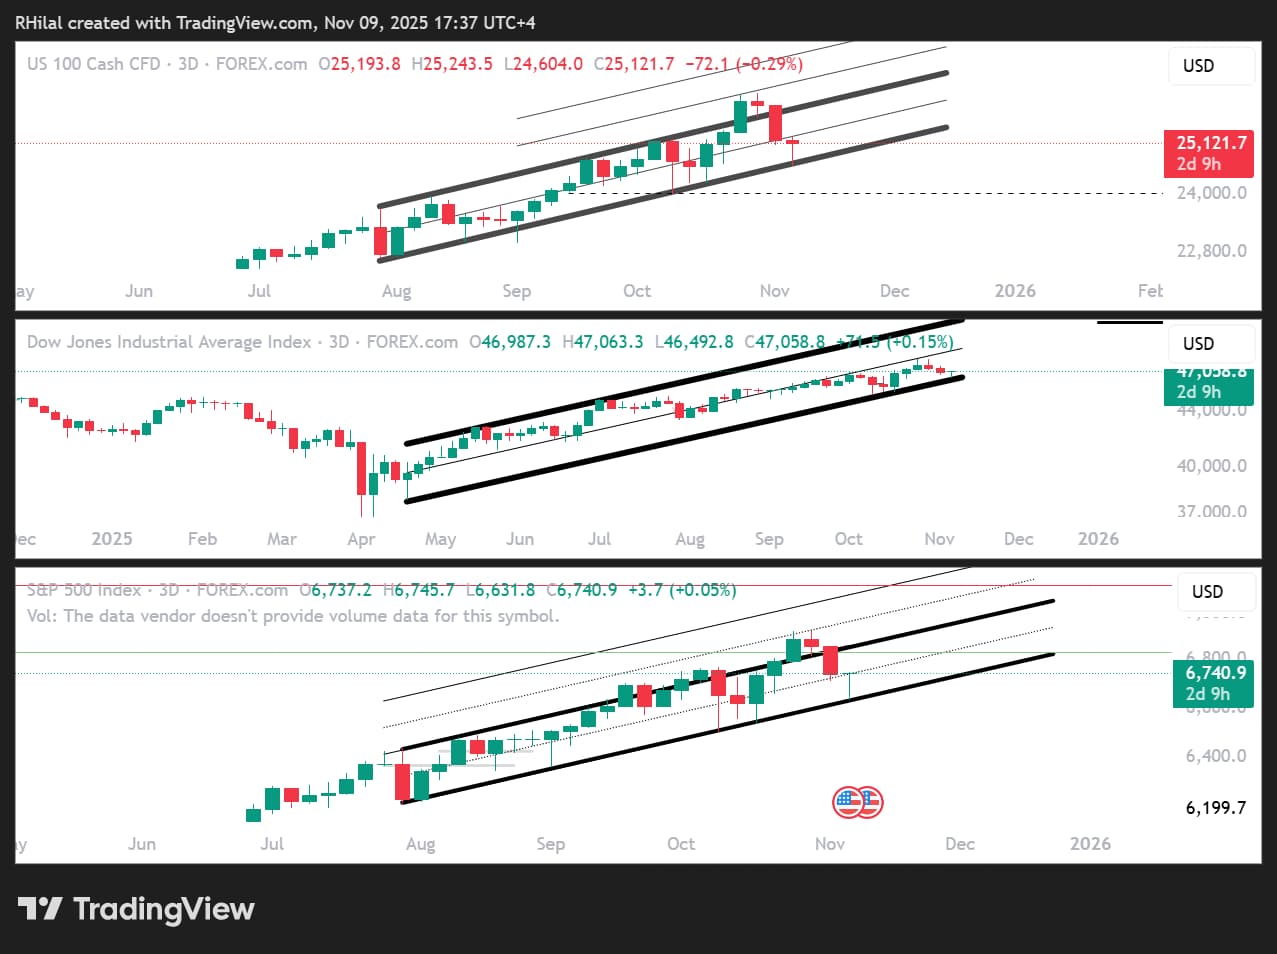
The S&P 500 and Nasdaq remain within their ascending channels extending from August, while the Dow Jones continues to trade within a channel originating from April.
This alignment supports the case for a continuation in overall market risk sentiment toward year-end or, alternatively, a deeper retracement if prices close below their respective trendline boundaries.
By Friday evening, all three indices had rebounded from the lower boundaries of their channels toward the mid-zones, awaiting confirmation of a directional breakout.
- Dow Jones:
- Downside risk below 46,400
- Upside potential above 47,200
- Nasdaq:
- Downside risk below 24,600
- Upside potential above 25,800
- S&P 500:
- Downside risk below 6,630
- Upside potential above 6,770
These levels are expected to define market sentiment shifts, which in turn will help refine the outlook for crude oil prices.
WTI Outlook: Weekly Time Frame – Log Scale
Source: Tradingview
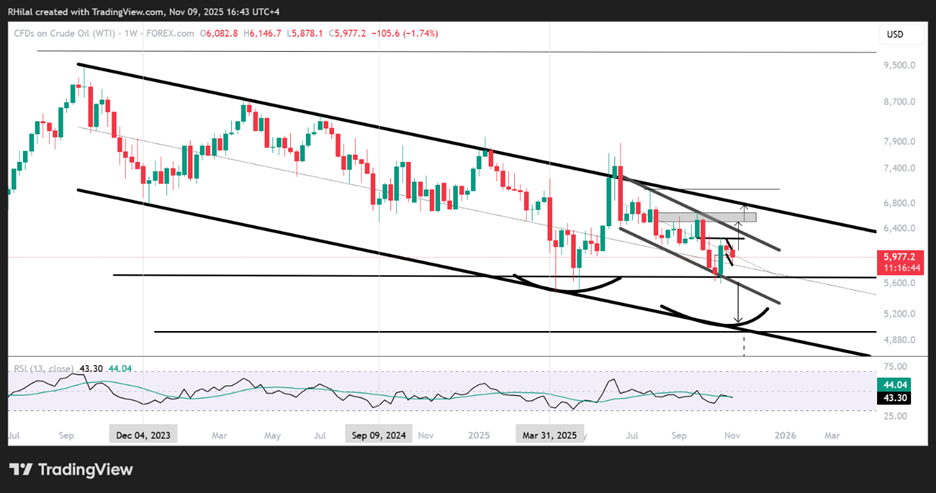
Crude prices are hovering near the 3 year down trending channel midzone , and the 5 month down Crude oil prices are currently hovering near both the mid-zone of the three-year downtrend channel and the mid-zone of the five-month channel, establishing key short-term and long-term reference points as the market navigates 2026 supply uncertainties and labor market risks.
A breakout above the short-term channel resistance, first at $63 and then $66.80, would extend potential gains toward the upper boundary of the long-term channel near $70, signaling the possibility of a sustained structural recovery in crude for the years ahead.
Conversely, a confirmed break below the lower boundary of the short-term channel and the yearly low at $55 could open the way toward the lower boundary near $49, where another technical rebound could develop.
Written by Razan Hilal, CMT
Follow on X: @Rh_waves
Related tags:




The complete CFD trading experience
Award-winning platforms, competitive spreads, low commissions and dedicated support.
We live and breathe the markets and are dedicated to helping traders realise their ambitions as we continue to set the industry bar.
Economic calendar
Web Trader platform
Our sophisticated web-based platform is packed with features.
Related articles

Gold Price Forecast: XAU/USD Plunges 12.4% Toward Critical Support 10 1 2026
Softer inflation has revived expectations for a Fed pause, but Friday’s payrolls could put gold’s recovery prospects to the test.


Nasdaq 100 Forecast: NDX slips as Treasury yields keep rising
U.S. stocks are falling at the start of Q4, as gains in software stocks offset concerns over soaring Treasury yields. U.S. Treasury yields continue to rise, with the 10-year yield up 2 basis points at 5.31% and the 30-year at 5.66%, multi-decade highs.


S&P 500 Forecast: SPX rises after cooler-than-expected inflation data
U.S. stocks are rising and Treasury yields are falling after data showed that inflation increased at a cooler pace than expected, while U.S. consumer spending rose again in August.
StoneX Europe Ltd may make third party material available on this website which may contain information included but not limited to the conditions of financial markets. The material is for information purposes only and does not contain, and should not be construed as containing, investment advice and/or investment recommendation and/or an investment research and/or an offer of or solicitation for any transactions in financial instruments; any decision to enter into a specific transaction shall be made by the client following an assessment by him/her of their situation.
StoneX Europe Ltd makes no representation or warranty and assumes no liability as to the accuracy or completeness of the information provided, nor any loss arising from any investment based on a recommendation, forecast or other information supplied. You should always seek independent advice as to your suitability to speculate in any related markets and your ability to assume the associated risks, if you are at all unsure. We are not under any obligation to update any such material. Any opinion made may be personal to the author and may not reflect the opinion of StoneX Europe Ltd.