




Dow Jones, China A50 look to go their separate ways
Wall Street indices may be around their record highs, yet the Dow Jones has been knocked from its perch and considering its next leg lower. Yet I suspect buyers are lurking around the China A50 in anticipation of its next leg higher.
Share this:

Wall Street indices may be around their record highs, yet the Dow Jones has been knocked from its perch and considering its next leg lower. Yet I suspect buyers are lurking around the China A50 in anticipation of its next leg higher.
Dow Jones technical analysis:
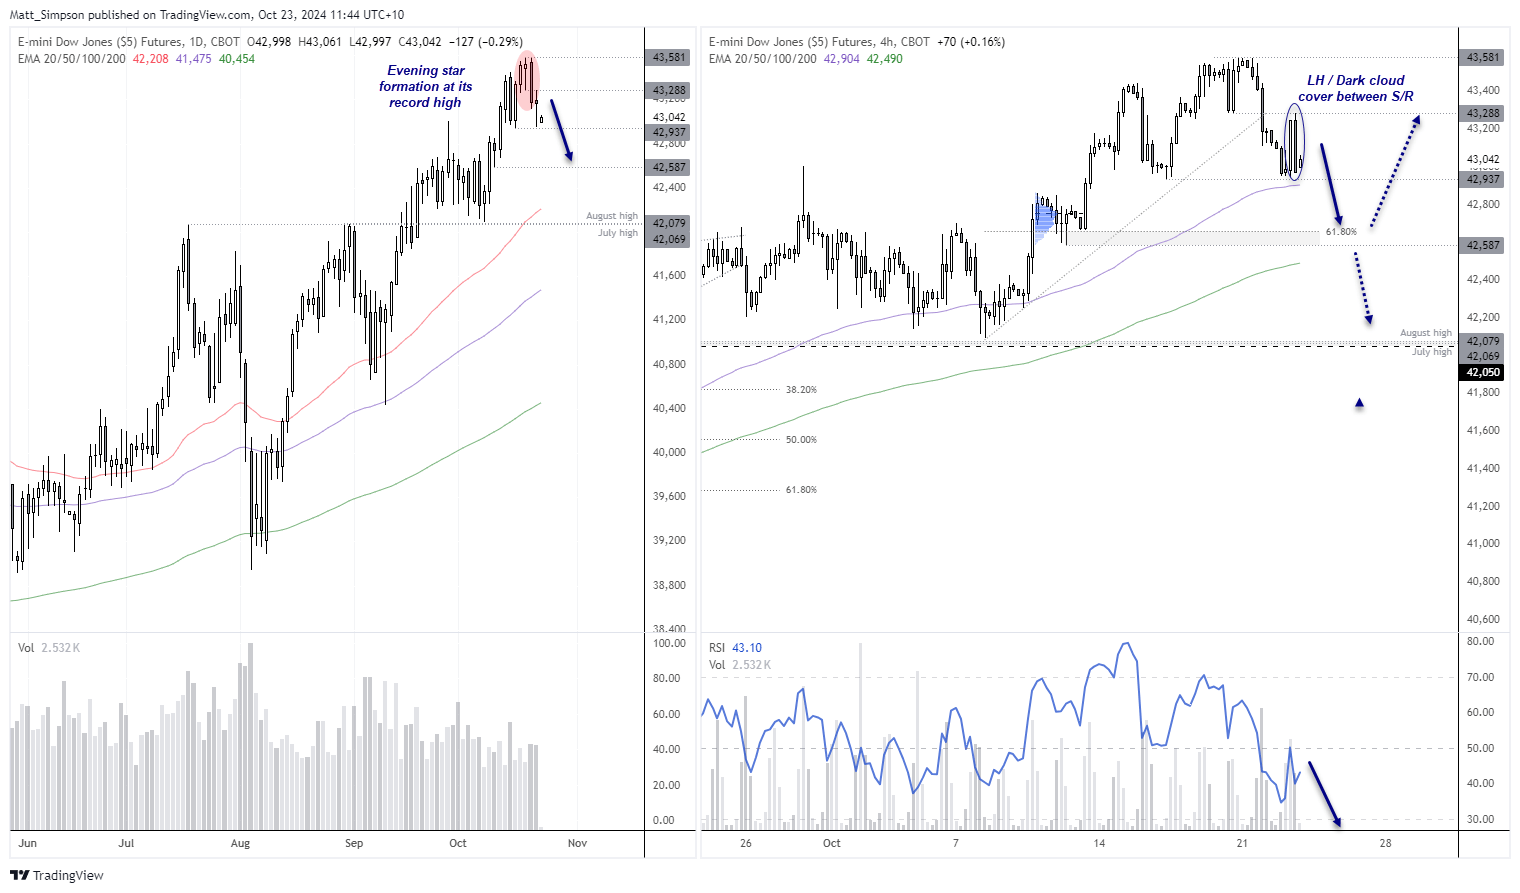
The recent outperformer on Wall Street is having second thoughts this week, with the Dow Jones now considering a break beneath its 43k level. A 3-star bearish reversal pattern has formed on the daily chart (evening star), and a lower high has since formed on the 4-hour chart.
A dark cloud cover also formed on the 4-hour chart, with its high respecting a prior support level at 43,288. A break beneath the 42,937 low assumes bearish continuation and brings the 42,587 low into focus near a 61.8% Fibonacci ratio.
Note that the 4-hour RSI (14) formed a bearish divergence ahead of the 3-day reversal, and has since confirmed the move lower. It has also yet to reach oversold, hence the bias for at least one more leg lower.
China A50 futures technical analysis:
The rally from the September low to October high was nothing short of impressive, having risen just shy of 50% in under three weeks. News of stimulus ahead of golden week was the news speculators had been waiting for, so much that many of seemed to be more focussed on buying more stocks during the holiday period over spending time with family.
Yet when cash markets reopened, traders were quick to book profits when it was revealed no further stimulus was imminent, resulting in a -21% retracement. This technically places the China A50 into a bear market, even if only just.
Still, buyers resurfaced around 13,000 and the monthly pivot point, allowing the China A50 market to form a prominent bullish engulfing day around the 61.8% Fibonacci level. The bullish candle was also on higher volume to suggest initiative buying.
- Bulls could seek dips within the bullish engulfing candle, in anticipation for a rise to at least 14,000 or the 2023 high (14,220)
- A initial minor retracement lower also seems likely given lower volumes since the bullish engulfing day
- We may need to wait for the 4-hour RSI (2) to dip into oversold before a swing low is formed and bullish momentum returns
-- Written by Matt Simpson
Follow Matt on Twitter @cLeverEdge
How to trade with City Index
You can trade with City Index by following these four easy steps:
- Open an account, or log in if you’re already a customer
• Open an account in the UK
• Open an account in Australia
• Open an account in Singapore
- Search for the market you want to trade in our award-winning platform
- Choose your position and size, and your stop and limit levels
- Place the trade
Related tags:
Latest market news




The complete CFD trading experience
Award-winning platforms, competitive spreads, low commissions and dedicated support.
We live and breathe the markets and are dedicated to helping traders realise their ambitions as we continue to set the industry bar.
Economic calendar
Web Trader platform
Our sophisticated web-based platform is packed with features.
Related articles
Silver's bullish breakout case builds as bond yields retreat
The Democratic blue wave has sent crude and Treasury yields sharply lower, improving the outlook for precious metals. With gold already breaking higher, could silver be next?
Swiss Franc Short-term Outlook: USD/CHF Selloff Nears Critical Support Ahead of NFP 11 4 2026
USD/CHF bears are closing in on critical trend support, with the next reaction likely to determine whether the October decline has further to run.

US Midterm Fallout: What Does the “Blue Tsunami” Mean for the S&P 500?
Democrats made sweeping gains in the US midterm elections, winning control of both the House and Senate - what does it mean for the S&P 500 and the AI trade?

StoneX Europe Ltd may make third party material available on this website which may contain information included but not limited to the conditions of financial markets. The material is for information purposes only and does not contain, and should not be construed as containing, investment advice and/or investment recommendation and/or an investment research and/or an offer of or solicitation for any transactions in financial instruments; any decision to enter into a specific transaction shall be made by the client following an assessment by him/her of their situation.
StoneX Europe Ltd makes no representation or warranty and assumes no liability as to the accuracy or completeness of the information provided, nor any loss arising from any investment based on a recommendation, forecast or other information supplied. You should always seek independent advice as to your suitability to speculate in any related markets and your ability to assume the associated risks, if you are at all unsure. We are not under any obligation to update any such material. Any opinion made may be personal to the author and may not reflect the opinion of StoneX Europe Ltd.