





Dow Jones, Nasdaq forecast: Key levels for US indices
The recent underperformance of the Dow Jones has not come without warning, as asset managers have been reducing their net-long exposure for several weeks now. Yet the Nasdaq remains above 18k, which means it may be better suited for bulls should sentiment improve and leave the Dow Jones for bears to consider fading into, should prices rebound.
Share this:

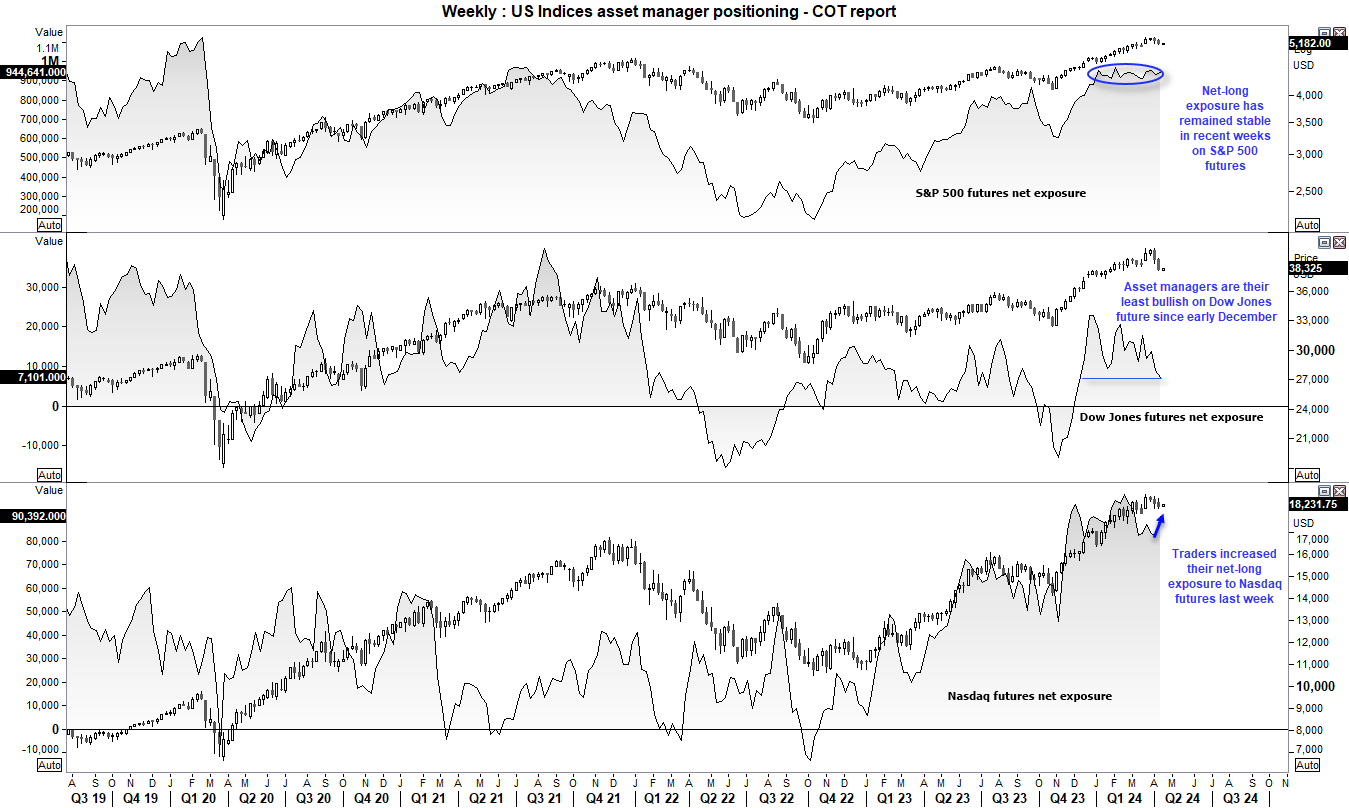
Over the past couple of months I have pointed out that there was a divergence between net-long exposure of asset managers and rising US indices. Yet what became more apparent recently was that the Dow Jones was the least popular of the three, as net-long exposure has since fallen to its least bullish level since early December. And traders could actually flip to net-short exposure against the Dow Jones in a few weeks of bears continue to close longs and initiate fresh shorts at a similar pace to the last few weeks.
This alone suggests that bears may want to limit their short positions for the Dow Jones. Also note that net-long exposure to S&P 500 futures has remained stable around its cycle highs in recent weeks, and bullish exposure actually increased to Nasdaq 100 futures last week. And that suggests bulls may have better luck with longs on the Nasdaq 100 or S& 500, given their ability to hold above support levels despite the recent bout of risk off.
Ultimately, until we see a material pickup of shorts bets against the Nasdaq 100 or S&P 500, any pullback for these indices could be limited compared to the Dow. But that is not to say they cannot fall further from here.
The combination of tensions from the Middle East alongside the growing realisation that the Fed not have to hike at all this year could take their toll on sentiment. And whilst nobody want to consider this right now, what if the Fed actually do have to hike rates again? I suspect we’d see some serious repricing, and not in the favour of risk assets such as US indices.
S&P 500, Nasdaq, Dow Jones weekly chart:
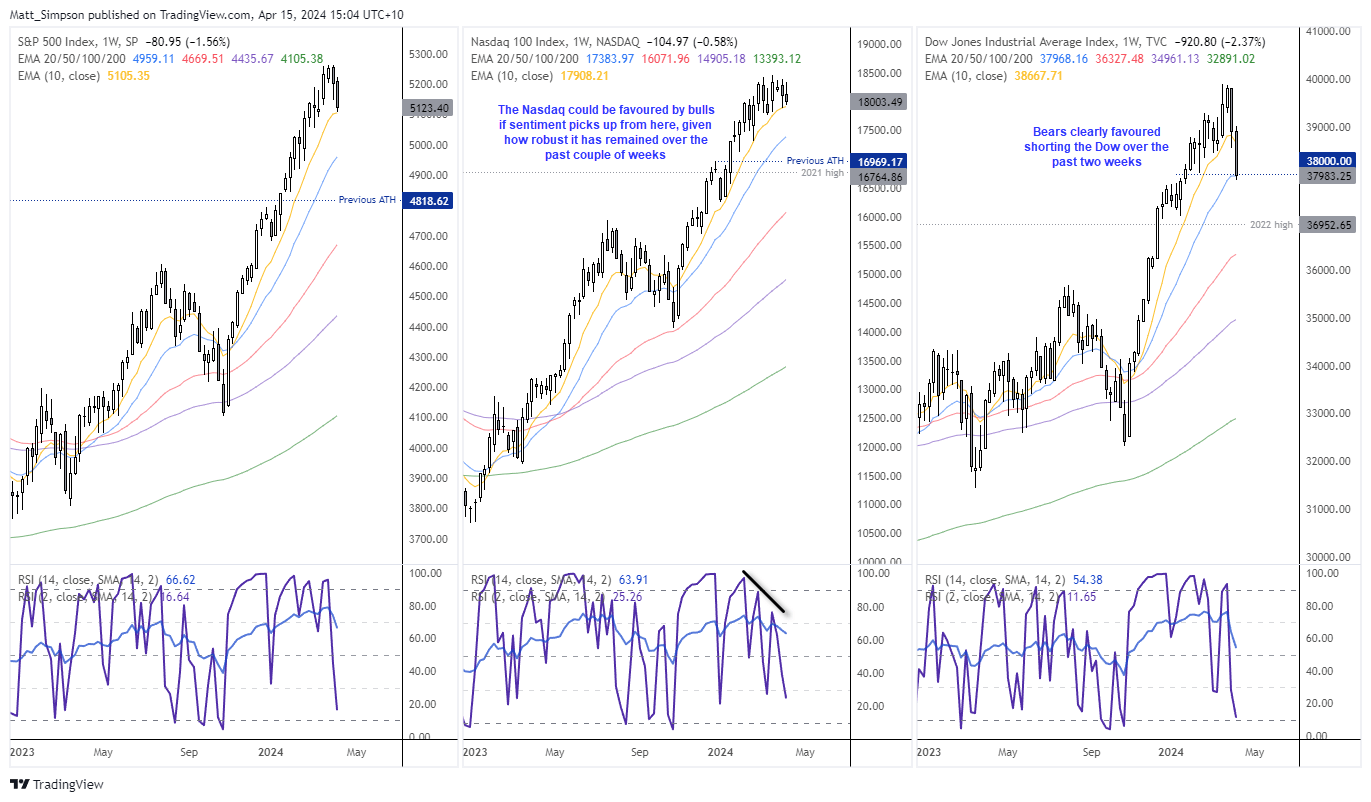
We know that US indices tend to track each other very closely the majority of the time, but a quick look at the weekly charts shows how they can also differ. Overall, bearish setups are preferred on the Dow Jones and bullish ones on the Nasdaq.
- The S&P 500 fell close to 3% over the past two weeks yet remains above its 10-week EMA
- The Nasdaq formed a small inside week and also remains above its 10-week EMA
- The Dow Jones broke beneath its 10-week EMA last week, closed on its 20-day EMA and had the weakest rally above its old prior high
Dow Jones futures technical analysis (daily chart):
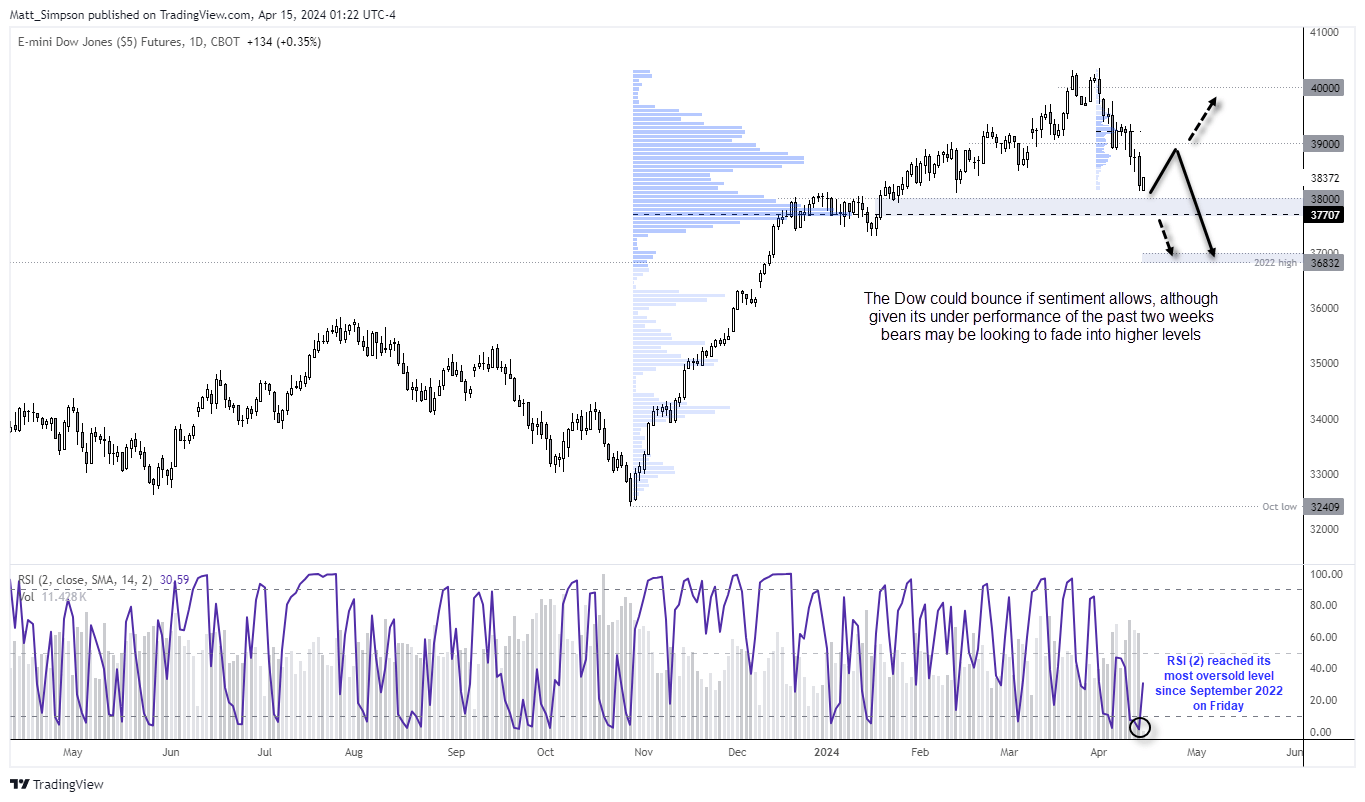
The Dow Jones failed to hold above the 40k level on two occasions, leaving a double top just above that key milestone level. The index has fallen in a relatively straight line, and the market is holding above 38k for now. RSI (2) reached its most oversold level this year on Friday, and with headlines that Israel is not looking to retaliate against Iran, then perhaps there is an opportunity for a bounce from current levels.
However, given the depth of the decline from the highs against the Nasdaq and S&P 500, I suspect any upside bounce could underperform. Therefore, bears may want to monitor any such bounce for evidence of a swing high in anticipation of an eventual break beneath 38k.
Nasdaq 100 futures technical analysis (4-hour chart):
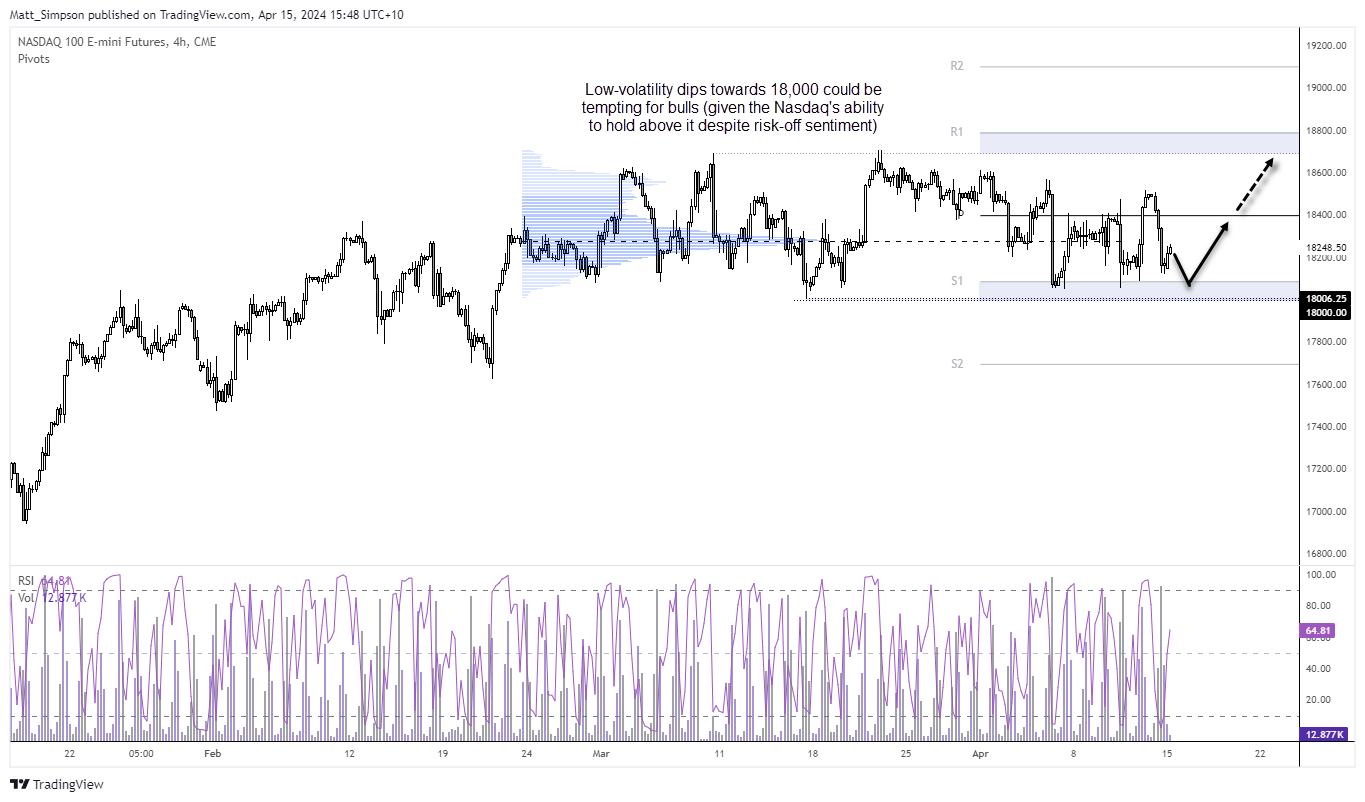
Despite all that has been thrown at it, the Nasdaq remains defiant and not too far below its record highs. We’ve seen a slight rebound in Monday’s Asian trade, and prices seem a little hesitant to break above the 18,250 – 18,300 level, near the most traded price by volume during its sideways consolidation.
As sentiment is a little fragile, I would prefer to see prices pull back towards last weeks lows before seeking longs. There is clearly support above 18,000, so any low-volatility towards it could be tempting for bulls to seek a bounce towards 18,250 – 18,300. And should US data remain firm and geopolitical tensions recede, perhaps it can break above 18,400. But should war in the Middle East escalate, a break beneath 18,000 seems likely (but for that, I’d prefer to see bearish setups on the Dow Jones).
-- Written by Matt Simpson
Follow Matt on Twitter @cLeverEdge
How to trade with City Index
You can trade with City Index by following these four easy steps:
- Open an account, or log in if you’re already a customer
• Open an account in the UK
• Open an account in Australia
• Open an account in Singapore
- Search for the market you want to trade in our award-winning platform
- Choose your position and size, and your stop and limit levels
- Place the trade
Latest market news



The complete CFD trading experience
Award-winning platforms, competitive spreads, low commissions and dedicated support.
We live and breathe the markets and are dedicated to helping traders realise their ambitions as we continue to set the industry bar.
Economic calendar
Web Trader platform
Our sophisticated web-based platform is packed with features.
Related articles
Nasdaq 100 Forecast: NDX rebounds as oil prices fall and ahead of Apple earnings
U.S. stock indices are moving higher on Monday as tech and AI-related stocks steady following a shocking October. The mood remains cautious following the AI wobble, with more tech earnings due this week, U.S. midterm elections and a full U.S. economic data calendar.

Gold forecast: XAU/USD stabilised after recent falls – for now
Gold has started the first week of the new month trying to recover some ground after another bruising week. Oil prices have taken a sharp drop and that has allowed risk assets to bounce back, which has clearly helped the precious metal too. However, with sentiment remaining bearish towards the metals, and with $4000 level having been taken out last week, the path of least resistance is to the downside for gold.


GBP/USD outlook: Currency Pair of the Week | November 2, 2026
The GBP/USD heads into a crowded week of event risk, with the midterm elections, a Bank of England rate decision and Friday's non-farm payrolls report all capable of moving markets sharply. The greenback remains fundamentally well supported by a hawkish Federal Reserve, but much of that is already priced in, while the renewed sell-off in technology stocks has exposed its vulnerability.
StoneX Europe Ltd may make third party material available on this website which may contain information included but not limited to the conditions of financial markets. The material is for information purposes only and does not contain, and should not be construed as containing, investment advice and/or investment recommendation and/or an investment research and/or an offer of or solicitation for any transactions in financial instruments; any decision to enter into a specific transaction shall be made by the client following an assessment by him/her of their situation.
StoneX Europe Ltd makes no representation or warranty and assumes no liability as to the accuracy or completeness of the information provided, nor any loss arising from any investment based on a recommendation, forecast or other information supplied. You should always seek independent advice as to your suitability to speculate in any related markets and your ability to assume the associated risks, if you are at all unsure. We are not under any obligation to update any such material. Any opinion made may be personal to the author and may not reflect the opinion of StoneX Europe Ltd.