



EUR/USD, EUR/JPY Forecast: Euro Surges as Trump Signals Iran Deal
Euro strength accelerates as Trump outlines a path to end the Iran war, fuelling upside breaks in EUR/USD and EUR/JPY.
Share this:

- Trump signals ceasefire, outlines path to end Iran war
- Euro lifts as energy disruption fears begin to ease
- EUR/USD breaks higher, tests key moving average cluster
- EUR/JPY clears resistance, momentum favours further upside
Donald Trump has signalled the US and Iran may be nearing a lasting deal to end the Iran war, posting on Truth Social moments ago that he has agreed to a two-week ceasefire, conditional on Iran reopening the Strait of Hormuz. He also said the US has received a “workable” 10-point proposal from Tehran, adding that almost all key points of contention have already been agreed, with the two-week window intended to finalise the agreement.
That marks a clear break from previous deadline extensions. Earlier delays were framed around buying time or allowing talks to continue. This time, Trump is pointing to an agreed framework already in place, suggesting the conflict may be approaching its end unless final details fail to be resolved.
For Europe, the implications are extremely positive. As a major energy importer, the region has been hit hard by the disruption to oil flows, with the Strait of Hormuz sitting at the centre of it. If it stays open and supply starts to normalise, the pressure from elevated energy prices and supply disruptions begins to ease.
That’s why the euro is one of the big winners from the latest de-escalation, paving the way for potential upside against the dollar and across the crosses. That’s already playing out on the charts.
EUR/USD Breakout Tests Key Resistance Cluster
Source: TradingView
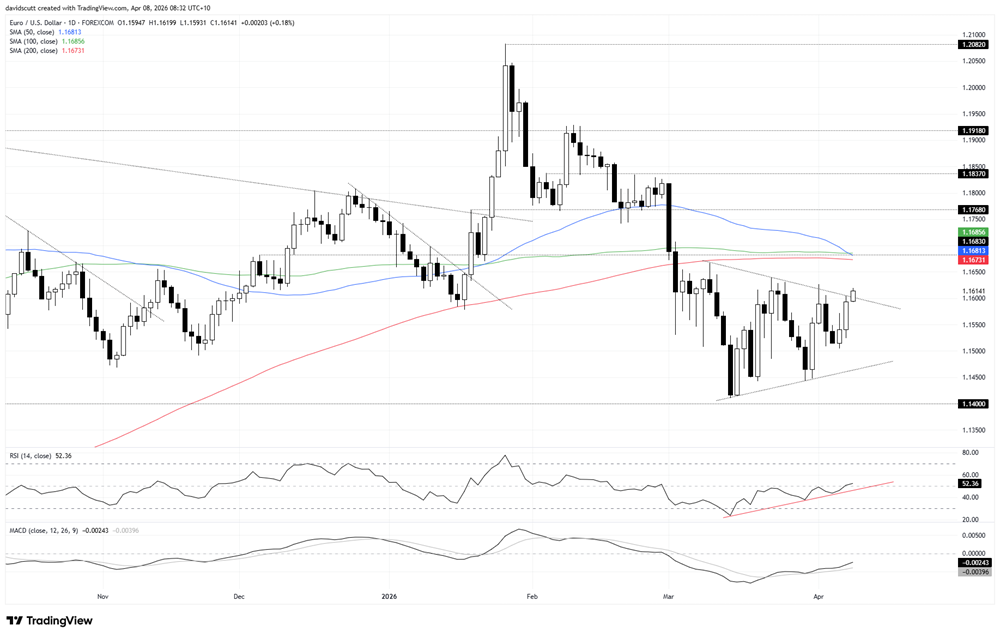
EUR/USD has broken from the triangle compression structure it had been coiling within for well over a month, even before Trump’s Truth Social post, with the announcement now helping extend the bullish breakout.
The price is now pushing into a key test immediately overhead, with the 50, 100 and 200-day moving averages converging around 1.1683, a level that has also acted as both support and resistance in recent months. If the price can clear that zone, it would likely embolden bulls to target a move towards 1.1768 and 1.1837, levels that have previously capped and supported moves.
If the price fails to break higher, former triangle resistance may flip to support, making it the immediate downside level to watch.
The oscillators are neutral overall, placing greater emphasis on price action to guide setup selection.
EUR/JPY Triangle Break Clears the Way Higher
Source: TradingView
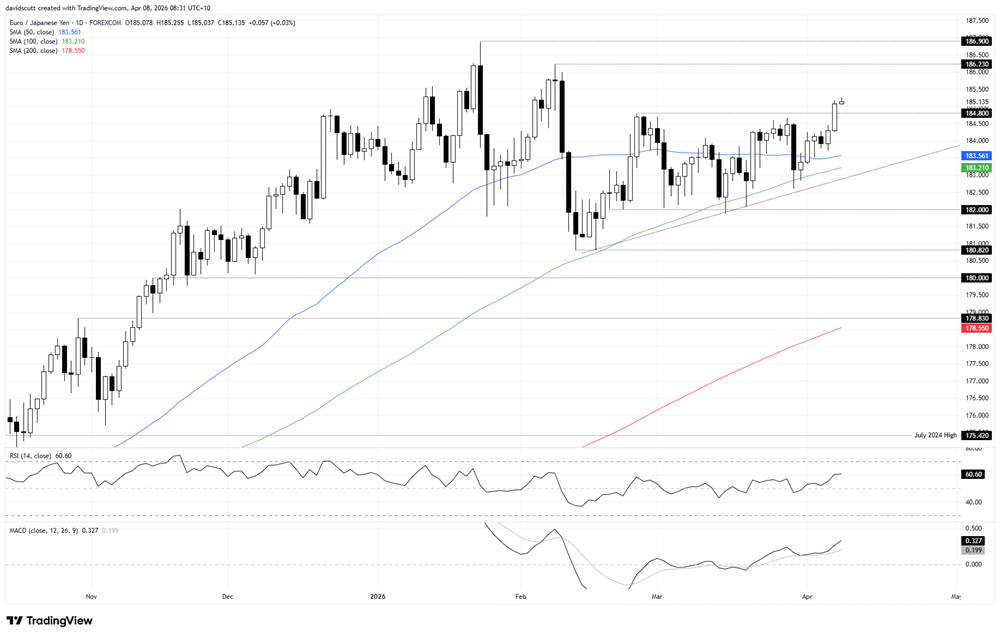
EUR/JPY has broken decisively higher from its ascending triangle, clearing resistance at 184.50 and taking out the February 25 high of 184.80.
That level now flips to support, providing a clean level to lean against for longs while the current risk-on tone holds.
RSI (14) and MACD favour a bullish bias, shifting the focus towards buying dips and breakouts, especially with the price holding well above key moving averages and the prior sequence of lower highs now broken.
The February 9 high of 186.23 is the first upside target, followed by the 2026 high at 186.90.
While Japan shares some similarities with Europe as a major energy importer, the yen remains more sensitive to shifts in global risk sentiment given its role as a funding currency, leaving the current backdrop favouring euro outperformance against the yen.
Latest market news




The complete CFD trading experience
Award-winning platforms, competitive spreads, low commissions and dedicated support.
We live and breathe the markets and are dedicated to helping traders realise their ambitions as we continue to set the industry bar.
Economic calendar
Web Trader platform
Our sophisticated web-based platform is packed with features.
Related articles
Swiss Franc Short-term Outlook: USD/CHF Selloff Nears Critical Support Ahead of NFP 11 4 2026
USD/CHF bears are closing in on critical trend support, with the next reaction likely to determine whether the October decline has further to run.

US Midterm Fallout: What Does the “Blue Tsunami” Mean for the S&P 500?
Democrats made sweeping gains in the US midterm elections, winning control of both the House and Senate - what does it mean for the S&P 500 and the AI trade?

USD/CAD Forecast: Canadian Dollar Gains Ground After U.S. Midterm Elections
The trading week continues to unfold and the recovery in the Canadian dollar has once again become a relevant theme in the short term. This can be clearly seen in the recent performance of USD/CAD, which is down nearly 0.4% during the session, reflecting a consistent recovery in the CAD against the U.S. dollar.
StoneX Europe Ltd may make third party material available on this website which may contain information included but not limited to the conditions of financial markets. The material is for information purposes only and does not contain, and should not be construed as containing, investment advice and/or investment recommendation and/or an investment research and/or an offer of or solicitation for any transactions in financial instruments; any decision to enter into a specific transaction shall be made by the client following an assessment by him/her of their situation.
StoneX Europe Ltd makes no representation or warranty and assumes no liability as to the accuracy or completeness of the information provided, nor any loss arising from any investment based on a recommendation, forecast or other information supplied. You should always seek independent advice as to your suitability to speculate in any related markets and your ability to assume the associated risks, if you are at all unsure. We are not under any obligation to update any such material. Any opinion made may be personal to the author and may not reflect the opinion of StoneX Europe Ltd.