



EUR/USD Jumps, USD Snaps Back After ECB and Jobs Data
While CPI and jobless claims both brought impact to the USD this morning, it may be a comment from Christine Lagarde that carries the most potential for trends in FX markets.
Share this:

EUR/USD, US Dollar Talking Points:
- The CPI report this morning was largely in line with expectations, as headline printed at 2.9% and Core at 3.1% just as markets were anticipating. The one item of difference was the month-over-month read for headline CPI that showed at 0.4% v/s the 0.3% expected and the 0.2% prior print.
- Perhaps more attention grabbing were the jobless claims numbers and of late it’s the labor market that’s had more drive for price action than inflation data, with USD holding near recent lows after the August 1st reversal after the NFP report, even as inflation remains well-above the Fed’s target.
- I’ll be looking at price action setups in USD pairs ahead of next week’s FOMC meeting, and you’re welcome to join. Click here to register.

The US Dollar is pushing back towards lows this morning after a busy outlay on the economic calendar. The CPI report was largely in-line with expectations, as headline YoY printed at 2.9% and Core at 3.1%. The one deviation of note was in the month-over-month print that arrived at 0.4% for headline against a 0.3% expectation and a 0.2% prior print, but perhaps more pressing for the USD was the higher-than-expected jobless claims print that came in at 263k v/s a 235k expectation.
Of late, it’s been weakness in the labor market that’s built a massive expectation for rate cuts from the Fed. While the unemployment rate remains at a relatively healthy 4.3% level, which Jerome Powell had opined was close to full employment at the July rate decision, the peripherals around employment don’t seem so positive. It was the August 1st report, which brought a large revision to the prior two months’ data that reversed the USD that had just completed its strongest month in more than three years. And then on Tuesday of this week we saw another massive revision to prior headline prints, further bringing question to the health of American labor markets.
And importantly, not to get lost in the shuffle, there was another item from this morning that may actually have more drive potential for USD-weakness, which was the European Central Bank rate decision. ECB President Christine Lagarde said that European disinflation was over, and this helped to push down odds for rate cuts out of Europe. That’s something that could bring more bullish potential to the single currency as the world prepares for the Fed to begin cutting rates.
I’ve been following this closely in EUR/USD of late and as shown last week, there were two different bullish breakout formations at work. The longer-term bull pennant and the shorter-term inverse head and shoulders patterns. Both were breached with the recent breakout, and as looked at in the webinar on Tuesday, the big question at that point was whether buyers would show up to hold a higher-low in the move, which so far has taken place.
This keeps the door open for continuation as we get closer to the FOMC rate decision next week, and now the fundamental side of the pair appears as though it can better mesh with the technical backdrop.
EUR/USD Daily Price Chart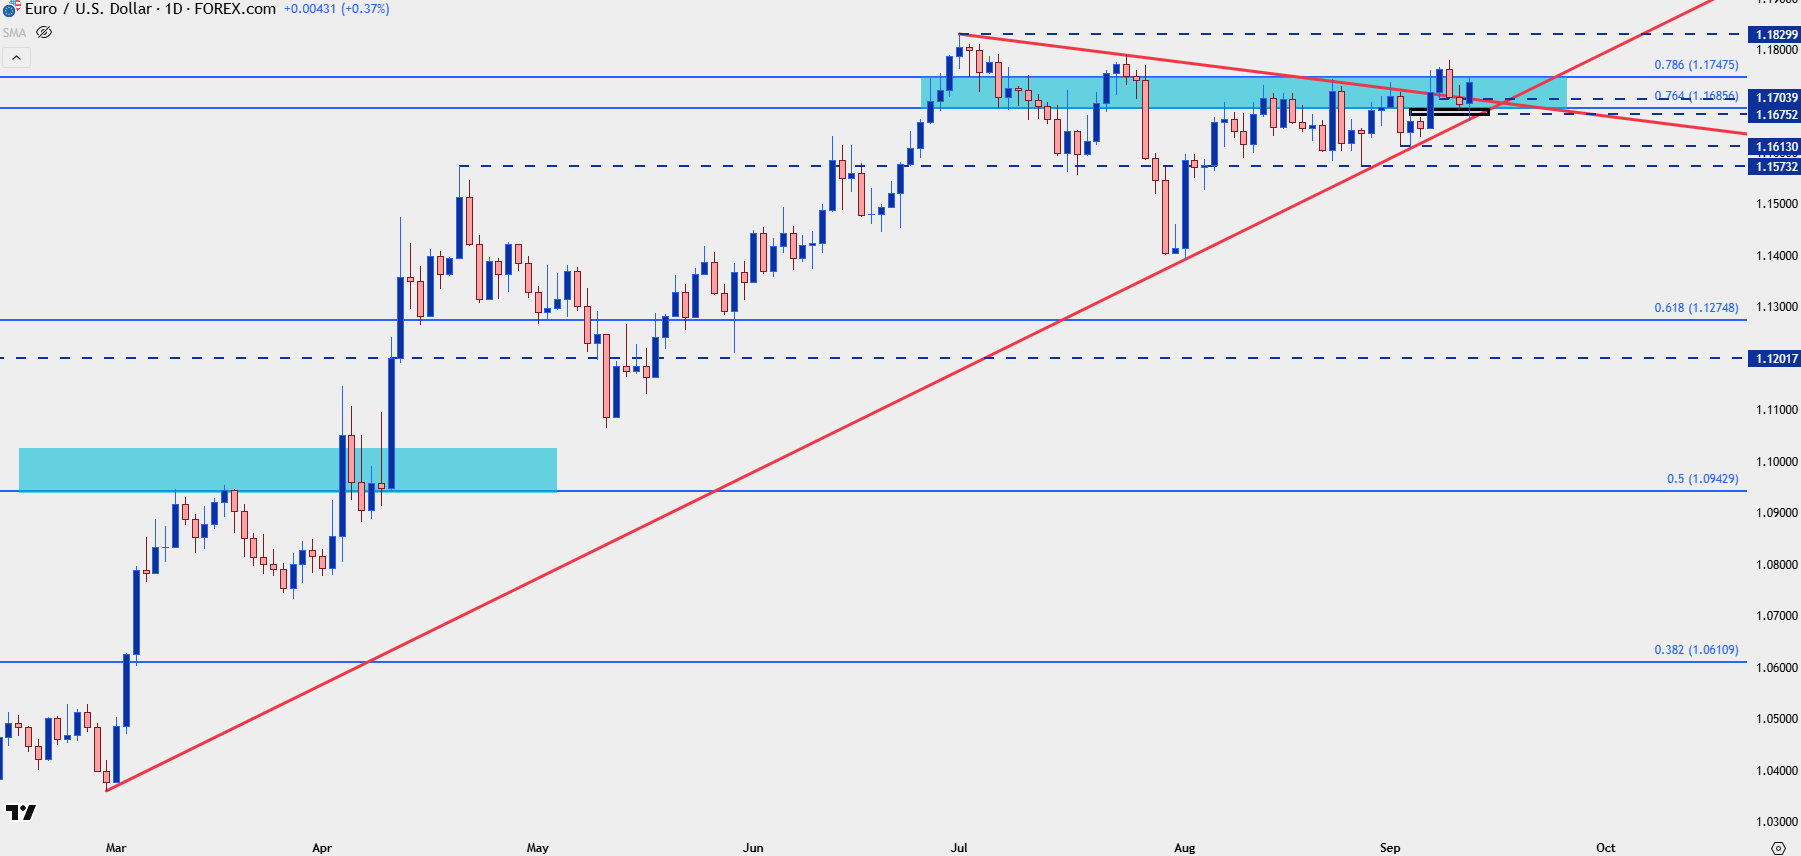
Chart prepared by James Stanley; data derived from Tradingview
EUR/USD Shorter-Term Setup
In that Tuesday webinar, I highlighted two spots of support, with a key zone around the Fibonacci level of 1.1686. As I said then, for bullish continuation strategies to remain in order, I would want to see buyers come in to respond to a test around that area, and so far that’s taken place, with prices making a push back up to the 1.1748 Fibonacci level.
This keeps the door open for bullish continuation strategies and the next areas of resistance are prior highs at 1.1780-1.1789 and then the recently established three-year high at 1.1830. Above all, it’s all about the 1.2000 big figure.
EUR/USD Four-Hour Price Chart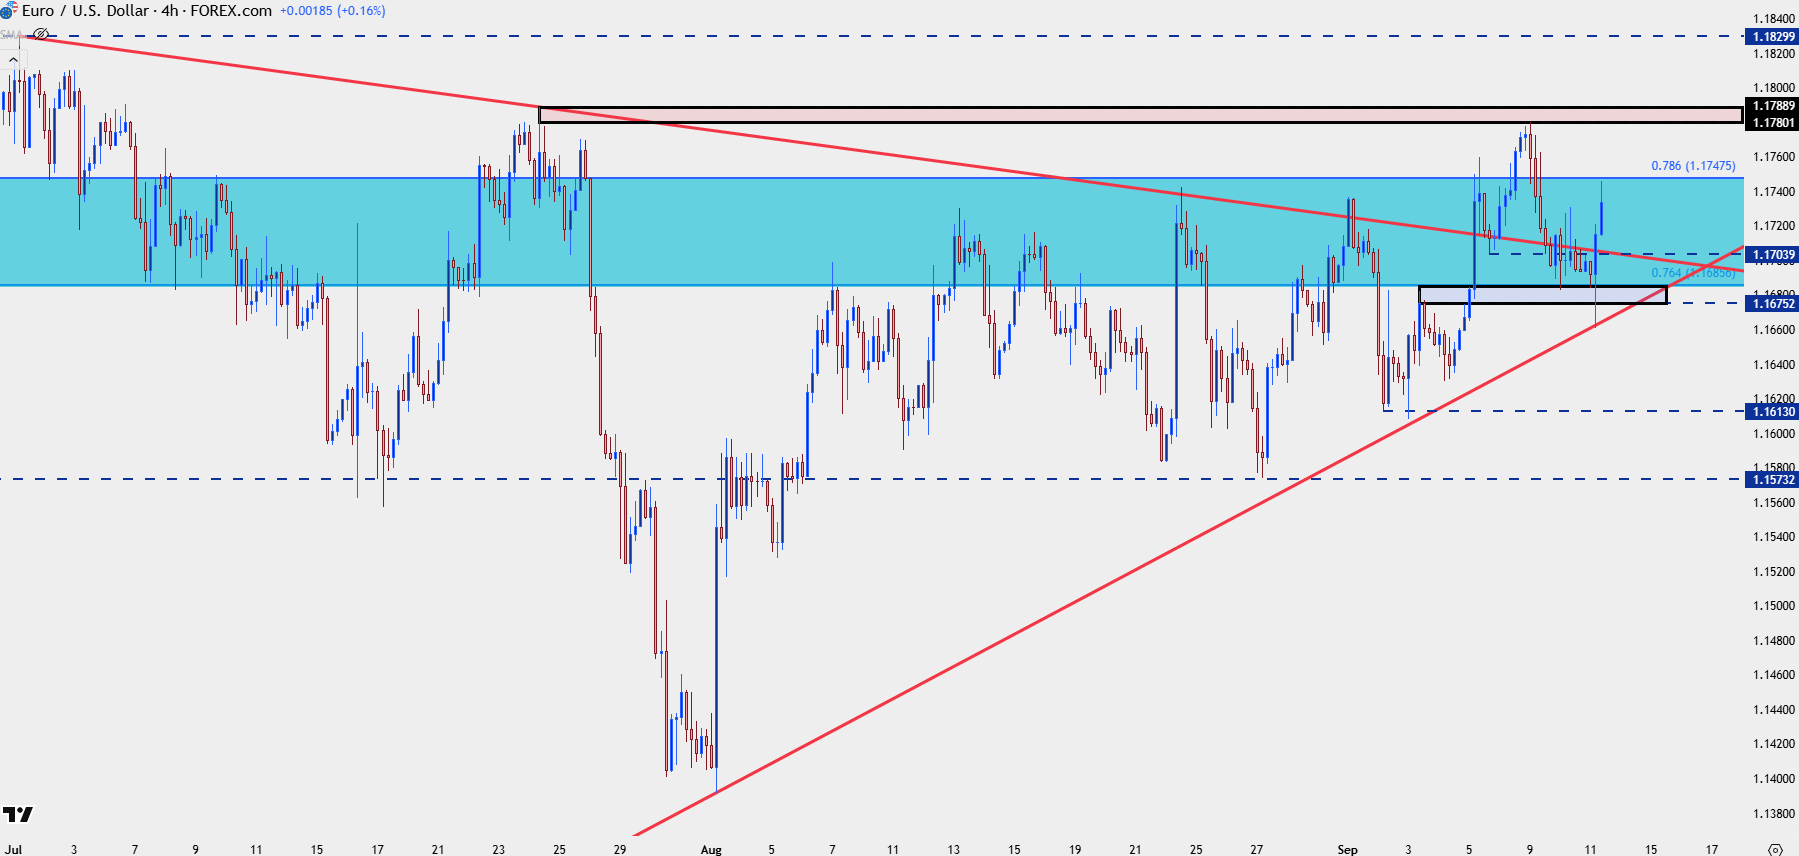
Chart prepared by James Stanley; data derived from Tradingview
USD
So far in Q3 it’s been pretty much a dud for USD bears. The currency set a fresh low on the first day of the quarter, and since then sellers have been unable to take out that swing. The first-half of this year was much like the first two months of Q3 last year, when markets were pricing in eventual rate cuts from the Fed by pummeling USD-lower.
While inflation remains high those jitters around the jobs market are very real, and at this point markets have went heavy with pricing in rate cuts out to the end of next year. It would seem as though the bar is set incredibly high for USD-bears to get another shot in the arm and finally take out that low on the way to even lower-lows.
But this is why I wanted to note that comment from Christine Lagarde in the above section, as currencies have a unique place in the financial landscape…
Since currencies are the base of the global financial system, the only way to value a currency is with another currency. So, it’s not enough to just say ‘the Euro has been weak’ because it all depends on what we’re comparing it against. This is why spot FX is traded in pairs, because perhaps the Euro has been weak against the US Dollar, but it still may be stronger than the British Pound or Japanese Yen – it’s all about relative valuations.
This can get tricky with the US Dollar especially if we’re looking at the DXY basket, as that’s a basket of underlying currencies although DXY is also a standalone futures product. But, the composition of that basket is important as seeing weakness in those underlying currencies, even in light of negative or bad US data, could produce gains and strength in DXY.
I talked about the Dollar basket in an article last year and it’s important to remember that the Euro is a whopping 57.6% allocation of the DXY, which means that it’s often difficult for the US Dollar to trend without at least some participation from the Euro in the opposite direction. And given that Lagarde has tamped down hopes for near-term rate cuts out of the Eurozone, combined with the expectation for the Fed to go into a cutting cycle – along with that bullish technical backdrop in EUR/USD looked at above, there could finally be bearish potential for the Dollar in the week ahead.
At this point, the US Dollar finds itself in a critical long-term spot on the chart. The below monthly chart shows two trendlines, with a bullish trendline starting in 2011 and connecting in 2021 which has recently come into play to help set the low. And there’s a bearish trendline beginning in 2001 and connecting in 2020 that’s been in-play as support on a shorter-term basis.
US Dollar Monthly Price Chart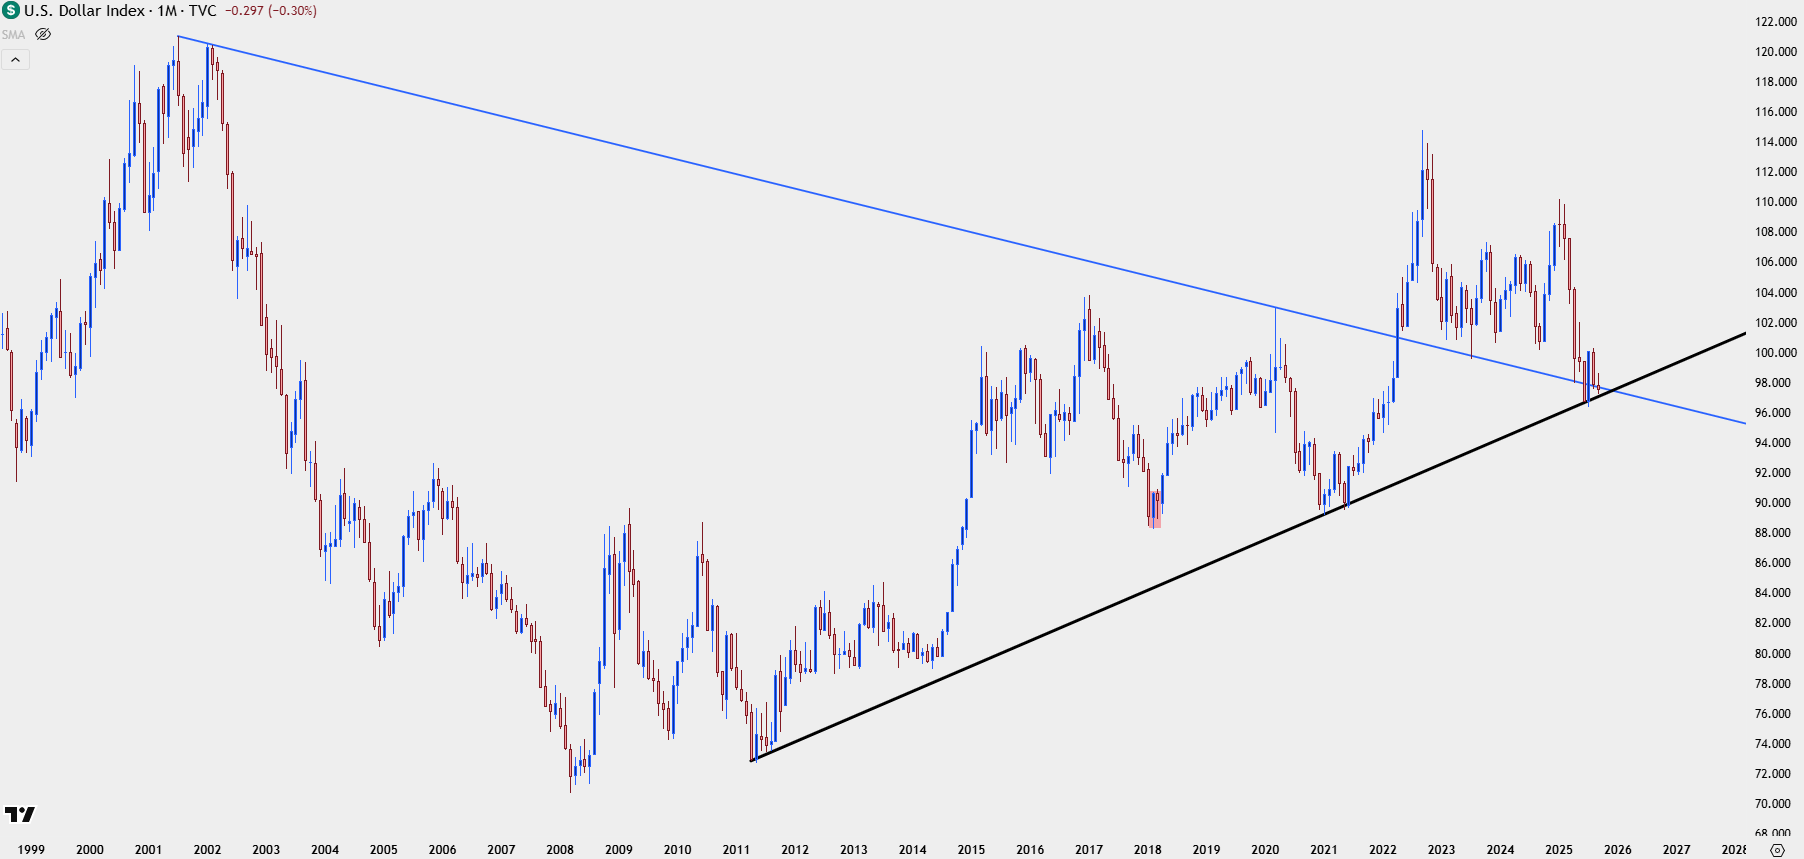
Chart prepared by James Stanley; data derived from Tradingview
USD Daily
From the daily chart we can get better view of that recent stall as USD bears have so far shied away from re-testing significant lows. Given how aggressively markets have already priced-in rate cuts around the FOMC, this would likely also need some help from the Euro to create a deeper breakdown scenario. This places lines in the sand around 97.11 and then 96.38.
US Dollar Daily Chart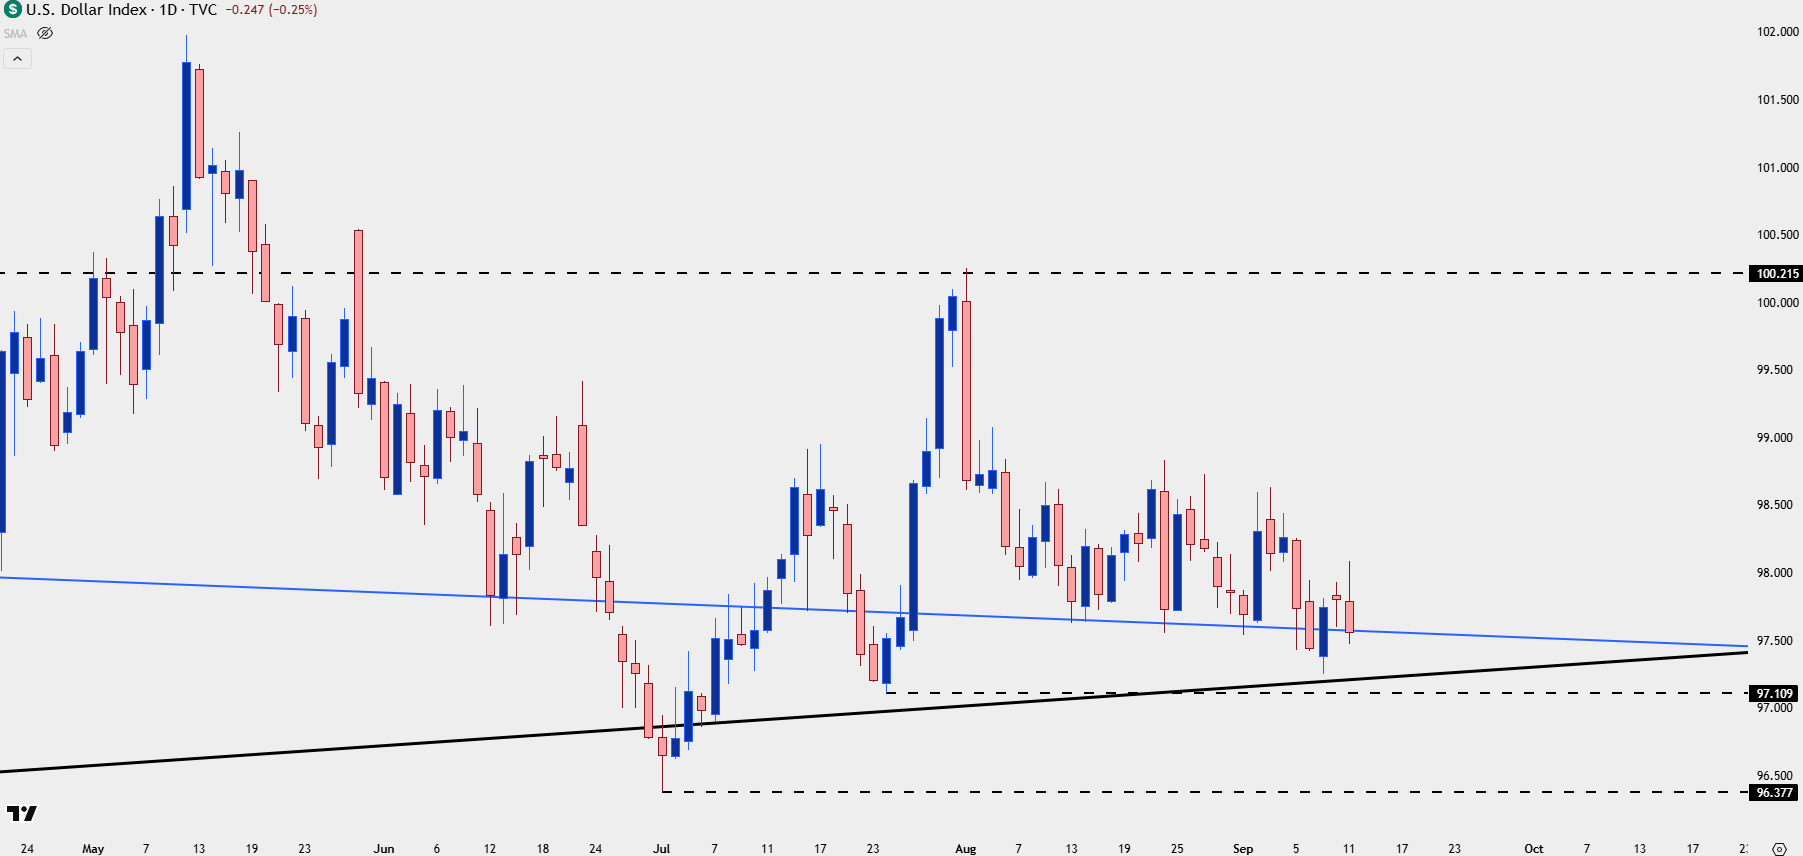
Chart prepared by James Stanley; data derived from Tradingview
--- written by James Stanley, Senior Strategist
Related tags:



The complete CFD trading experience
Award-winning platforms, competitive spreads, low commissions and dedicated support.
We live and breathe the markets and are dedicated to helping traders realise their ambitions as we continue to set the industry bar.
Economic calendar
Web Trader platform
Our sophisticated web-based platform is packed with features.
Related articles

USD/MXN Analysis: Is Super Peso Starting to Fade?
Over recent trading sessions, the Mexican peso has continued to show signs of weakness against the U.S. dollar. This can already be seen in USD/MXN, which has gained more than 1.7% over the last three sessions, highlighting sustained buying pressure in favor of the dollar in the short term.


Nasdaq 100 Forecast: NDX slips as Treasury yields keep rising
U.S. stocks are falling at the start of Q4, as gains in software stocks offset concerns over soaring Treasury yields. U.S. Treasury yields continue to rise, with the 10-year yield up 2 basis points at 5.31% and the 30-year at 5.66%, multi-decade highs.


US Dollar Technical Outlook: DXY Bulls Meet Resistance at Yearly Highs 10 1 2026
The U.S. Dollar has held firm despite fading Fed hike bets, but Friday’s payrolls could test the rally’s staying power.

StoneX Europe Ltd may make third party material available on this website which may contain information included but not limited to the conditions of financial markets. The material is for information purposes only and does not contain, and should not be construed as containing, investment advice and/or investment recommendation and/or an investment research and/or an offer of or solicitation for any transactions in financial instruments; any decision to enter into a specific transaction shall be made by the client following an assessment by him/her of their situation.
StoneX Europe Ltd makes no representation or warranty and assumes no liability as to the accuracy or completeness of the information provided, nor any loss arising from any investment based on a recommendation, forecast or other information supplied. You should always seek independent advice as to your suitability to speculate in any related markets and your ability to assume the associated risks, if you are at all unsure. We are not under any obligation to update any such material. Any opinion made may be personal to the author and may not reflect the opinion of StoneX Europe Ltd.