
Euro, EUR/USD Talking Points:
- EUR/USD is re-testing the 1.1748 Fibonacci level to start the week.
- From the weekly chart, bears have had an open door over the past two months to elicit a larger pullback or possibly even reversal, but the underside wicks highlight bulls rebuffing those attempts, and now the door is open for buyers to press against the highs.
- It’s a big week and a half for EUR/USD as the Thursday ECB meeting is followed by CPI out of the US, and then next Wednesday brings the FOMC rate decision.

While it was an active and trending first-half of the year, the past two months have been considerably more grindy in EUR/USD. The pair set a fresh three-year high on the first day of Q3, and since then it’s been almost all digestion.
Of course the month of July did show some pullback, as the pair pushed down for a test of the 1.1400 handle, and that was alongside a US Dollar that showed its strongest monthly gain in more than three years. But the NFP report released on the first day of August served to reset matters a bit as markets got aggressive with pricing in rate cuts from the Fed, and we’re now near the point where the rubber meets the road on that topic with the FOMC meeting scheduled for next Wednesday.
Inflation has remained high from both Core PCE and CPI fronts, and that’s expected to continue with Thursday’s release as headline CPI is expected to have jumped up to 2.9% from last month’s 2.7% print. Core CPI re-crossed the 3% barrier last month and while that might not seem conducive for rate cuts, expectations have continued to build that next week will see the Fed kick off a cutting cycle that will last into and perhaps even through the end of next year.
In EUR/USD, bulls set a fresh monthly high on the heels of last Friday’s NFP report, and price continues to test a key Fibonacci resistance level at 1.1748.
EUR/USD Weekly Price Chart
Chart prepared by James Stanley; data derived from Tradingview
EUR/USD Digestion
The first two months of Q3 were digestion for EUR/USD, with a notable sell-off in July leading into pullback in August. But, on net, that made for both higher-lows and lower-highs which built into a symmetrical triangle formation. Normally, a formation of that nature would come with no directional bias, as it’s both lower-highs and higher-lows, but given the prior bullish trend and the fact that a larger pullback did not show, a bullish bias can be justified as the triangle can be classified as a bull pennant.
As an illustration elsewhere, this is like the formation that had built in gold ahead of the Jackson Hole speech from Jerome Powell, which is when markets got a fresh shot-in-the-arm for rate cut hopes as the head of the US Central Bank seemingly sounded like he was ready to cut rates, a far different tone than he had a few weeks prior at the FOMC meeting.
Not all bull pennants will resolve with a bullish breakout, of course, but given the rally on NFP Friday that’s what has so far shown in EUR/USD. The big question now is whether bulls will have the ability to stretch the move and that puts on the radar the 1.1830 swing high from the first day of Q3, after which the 1.2000 psychological level comes into play.
EUR/USD Daily Chart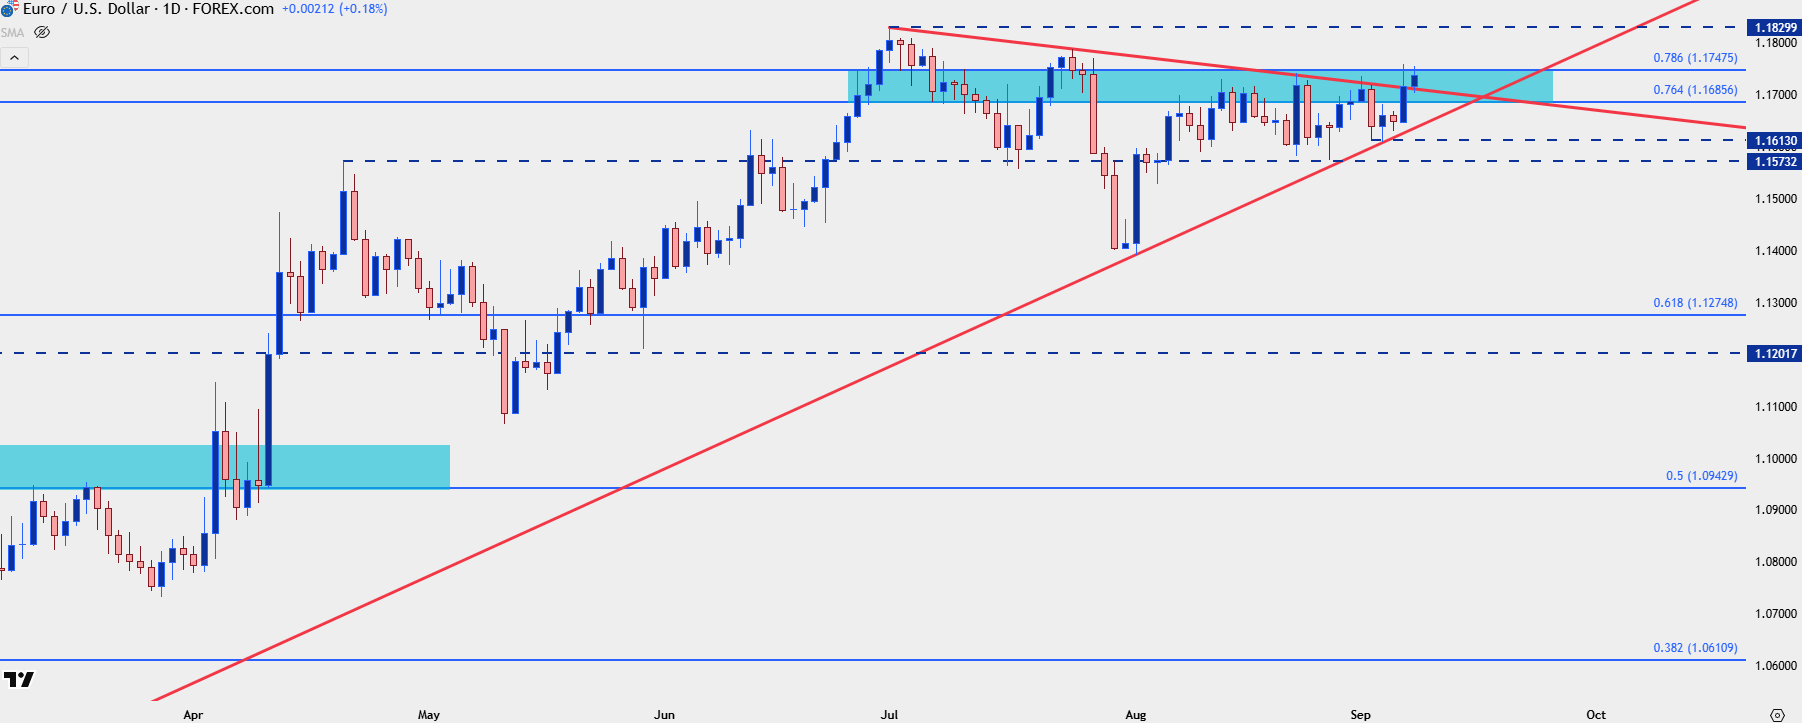
Chart prepared by James Stanley; data derived from Tradingview
EUR/USD Shorter-Term Strategy
At this point we can see a second attempt from bulls to break the 1.1748 level which has so far proven resistant again. But, we can also identify recent bullish structure that can allow for shorter-term strategy in consideration of that longer-term look above. There’s so far been a higher-low at 1.1709, and just below that, we have the Fibonacci level at 1.1686 which syncs to the prior swing high of 1.1675 that creates a support zone to follow. A show of support at either of those areas can be of consideration for bullish continuation potential, and given the build of support last week 1.1613, there would also be an area of invalidation as a breach below that price will begin to take on the tone of a failed breakout attempt.
EUR/USD Four-Hour Chart
Chart prepared by James Stanley; data derived from Tradingview
--- written by James Stanley, Senior Strategist